%%{init: {
  "theme": "base",
  "themeVariables": {
    "fontSize": "11px"
  },
  "flowchart": {
    "nodeSpacing": 20,
    "rankSpacing": 25
  }
}}%%

flowchart TB
    A["Sheep farming"] --> B["Shearing and sorting<br/>of raw wool"]
    B --> D["Spinning into wool yarn"]
    D --> E["Weaving the white woollen cloth"]
    E --> F["Fulling, cleaning,<br/>bleaching, cutting"]
    F -->|"approx. 100 sesterces per pound"| H["Attaching the purple border<br/>Making up the toga"]

    P2["Snail breeding"]
    P2 --> P3["Extracting glands<br/>(hypobranchial gland)"]
    P3 --> P4["Salting glands &<br/>heating over several days"]
    P4 --> P7["Dyeing wool / wool batches<br/>purple"]
    P7 -->|"4,000 sesterces per pound"| H

    T["Total value: 400 - 1,200 sesterces per toga"]

    H ~~~ T

    classDef raw fill:#f5f1e8,stroke:#7a6a4f,color:#2b2b2b;
    classDef proc fill:#eef4fb,stroke:#5179a6,color:#112d3d;
    classDef purple fill:#f4e8fb,stroke:#7a3ea1,color:#321744;
    classDef note fill:#fff8d9,stroke:#b89b2e,color:#3a3212,stroke-width:0.01px;

    class A,B,D,E raw;
    class P2,P3,P4,P7 purple;
    class F,H proc;
    class T note;
Supply Chain Management
Winter semester 2026/27
Matthias Kalverkamp & Thomas Kirschstein
Introduction & Course Organisation
Course organisation
- Lecturers: Prof. Dr. Matthias Kalverkamp & Prof. Dr. Thomas Kirschstein
- Documents + materials: https://github.com/tkirschstein/SCM
- Case studies: 6 case studies in group work 3-6 persons
- Exam: reflection report
Literature
Baumast, Annett, and Jens Pape, eds. 2013. Betriebliches Nachhaltigkeitsmanagement. UTB / Verlag Eugen Ulmer.
Bray, Robert L., and Haim Mendelson. 2012. “Information Transmission and the Bullwhip Effect: An Empirical Investigation.” Management Science 58 (5): 860–75. https://doi.org/10.1287/mnsc.1110.1467.
Buscher, Udo, Anke Daub, Uwe Götze, Barbara Mikus, and Folker Roland. 2013. Produktion und Logistik: Einführung mit Fallbeispielen. Lehrbuchreihe. GUC – Verlag der Gesellschaft für Unternehmensrechnung und Controlling.
Cachon, Gérard, and Christian Terwiesch. 2024. Matching Supply with Demand: An Introduction to Operations Management. 5th ed. McGraw Hill.
Chen, Li, and Hau L. Lee. 2012. “Bullwhip Effect Measurement and Its Implications.” Operations Research 60 (4): 771–84.
Chopra, Sunil, and Peter Meindl. 2025. Supply Chain Management: Strategy, Planning, and Operation. 8th ed. Pearson.
Christopher, Martin. 2023. Logistics & Supply Chain Management. 6th ed. Pearson.
Cooper, Leon. 1968. “Solutions of Generalized Locational Equilibrium Models.” Journal of Regional Science 8 (1): 1–18. https://doi.org/10.1111/j.1467-9787.1968.tb01319.x.
Council of Supply Chain Management Professionals (CSCMP). 2013. CSCMP Supply Chain Management Definitions and Glossary of Terms. https://cscmp.org/CSCMP/Educate/SCM_Definitions_and_Glossary_of_Terms.aspx.
Daskin, Mark S. 2013. Network and Discrete Location: Models, Algorithms, and Applications. 2nd ed. Wiley.
Dedrick, Jason. 2012. Who Profits from Innovation in Global Value Chains? iPhones and Windmills.
Drezner, Zvi, and Horst W. Hamacher, eds. 2002. Facility Location: Applications and Theory. Springer.
Dyckhoff, Harald. 1998. Grundzüge der Produktionswirtschaft: Einführung in die Theorie betrieblicher Wertschöpfung. 2nd ed. Springer.
Dyckhoff, Harald, Richard Lackes, and Joachim Reese, eds. 2008. Nachhaltige Unternehmensführung: Grundlagen und Konzepte. Springer.
Günther, Edeltraud. 2008. Ökologieorientiertes Management: Um-(weltorientiert) Denken in der BWL. Lucius & Lucius.
Günther, Hans-Otto, and Horst Tempelmeier. 2012. Produktion und Logistik. 9th ed. Springer-Lehrbuch. Springer.
Hauff, Volker, ed. 1987. Unsere gemeinsame Zukunft: Der Brundtland-Bericht der Weltkommission für Umwelt und Entwicklung. Eggenkamp.
Hugos, Michael H. 2018. Essentials of Supply Chain Management. 4th ed. Wiley.
Kik, D. 2022. Zur modellbasierten Entscheidungsunterstützung von Unternehmen in der regionalen Standortplanung und -entwicklung. Springer Fachmedien Wiesbaden GmbH.
Klein, Robert, and Armin Scholl. 2011. Planung und Entscheidung: Konzepte, Modelle und Methoden einer modernen betriebswirtschaftlichen Entscheidungsanalyse. 2nd ed. Vahlens Handbücher der Wirtschafts- und Sozialwissenschaften. Vahlen.
Kummer, Sebastian, Oskar Grün, and Werner Jammernegg. 2018. Grundzüge der Beschaffung, Produktion und Logistik. 4th ed. Pearson Deutschland GmbH.
Lahner, Jörg. 2020. “Regionalökonomie und Standortfaktoren in der Wirtschaftsförderung.” In Handbuch Innovative Wirtschaftsförderung, edited by Jürgen Stember, Matthias Vogelgesang, Philip Pongratz, and Alexander Fink. Springer Gabler. https://doi.org/10.1007/978-3-658-21404-3_31.
Silver, Edward A., David F. Pyke, and Douglas J. Thomas. 2017. Inventory and Production Management in Supply Chains. 4th ed. CRC Press.
Sople, Vinod V. 2011. Supply Chain Management: Text and Cases. Pearson Education.
Stadtler, Hartmut. 2000. “Supply Chain Management: An Overview.” In Supply Chain Management and Advanced Planning: Concepts, Models, Software, and Case Studies, edited by Hartmut Stadtler and Christoph Kilger. Springer.
Stindt, Dennis. 2017. “A Generic Planning Approach for Sustainable Supply Chain Management-How to Integrate Concepts and Methods to Address the Issues of Sustainability?” Journal of Cleaner Production 153: 146–63.
Thonemann, Ulrich W. 2023. Operations Management. 4th ed. Pearson.
Tripp, Christoph. 2024. Distributions- und Handelslogistik. 3rd ed. Springer Gabler.
Werner, Hartmut. 2020. Supply Chain Management: Grundlagen, Strategien, Instrumente und Controlling. 7th ed. Springer Gabler. https://doi.org/10.1007/978-3-658-32429-2.
Yao, Yuliang, Yongrui Duan, and Jiazhen Huo. 2020. “On Empirically Estimating Bullwhip Effects: Measurement, Aggregation, and Impact.” Journal of Operations Management 67 (1): 5–30. https://doi.org/10.1002/joom.1090.
Structure of the lecture
- Fundamentals of Supply Chain Management
- Strategic Design of Supply Chains
- Uncertainty and Risk Management in Supply Chains
Fundamentals of Supply Chain Management
Fundamentals of Supply Chain Management
- Tasks, terms and concepts
- Objectives & trade-offs
- Costs & management
Learning objectives
After this unit you will be able to …
- explain key terms, actors and flows of a supply chain,
- distinguish supply chain management from logistics and procurement,
- differentiate between strategic, tactical and operational decisions in supply chains,
- assess the importance of coordination for value creation and competitiveness.
Further reading
- SCM fundamentals and decision levels: Chapters 1–3 in (Chopra and Meindl 2025).
- Strategies, instruments and controlling in the German-speaking context: Chapters 1–3 in (Werner 2020).
- Case-oriented introduction to supply chain structures: Chapters 1–3 in (Sople 2011).
Supply chains in History
Cheops and building supply chains
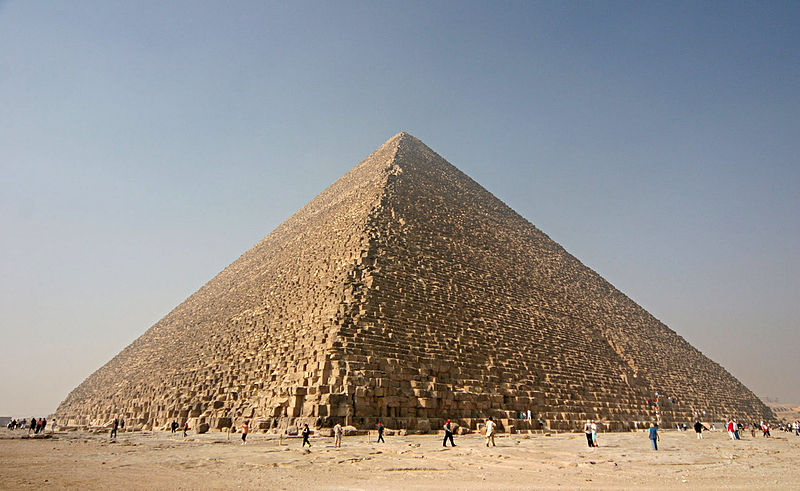
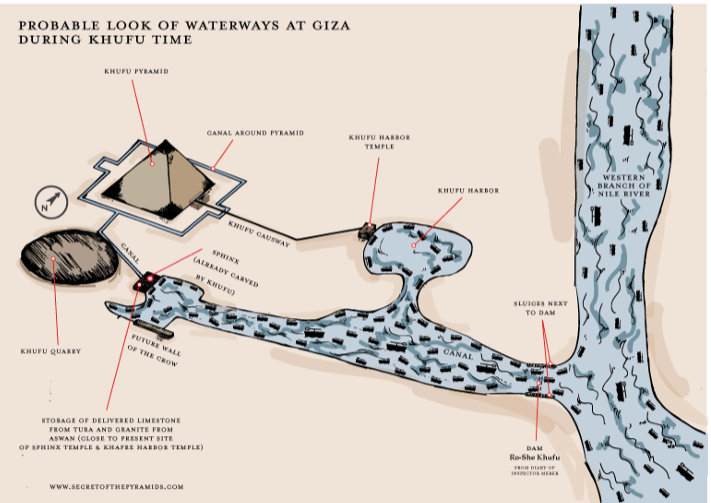
- Cheops pyramid building started about 2620 BC, ancient height: 147 m
- 2.3 million stone blocks, avg. 2.5 t each
- Required coordinated transport, tool inventory, and mass catering for about 100,000 workers
Supply chains in History
Hannibal’s invasion of Italy
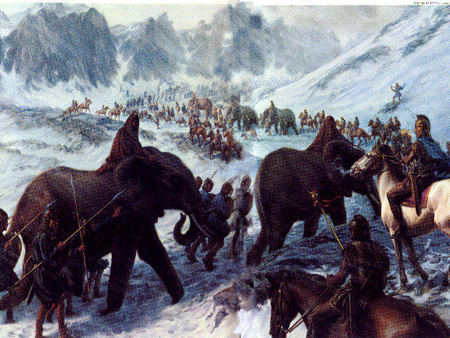
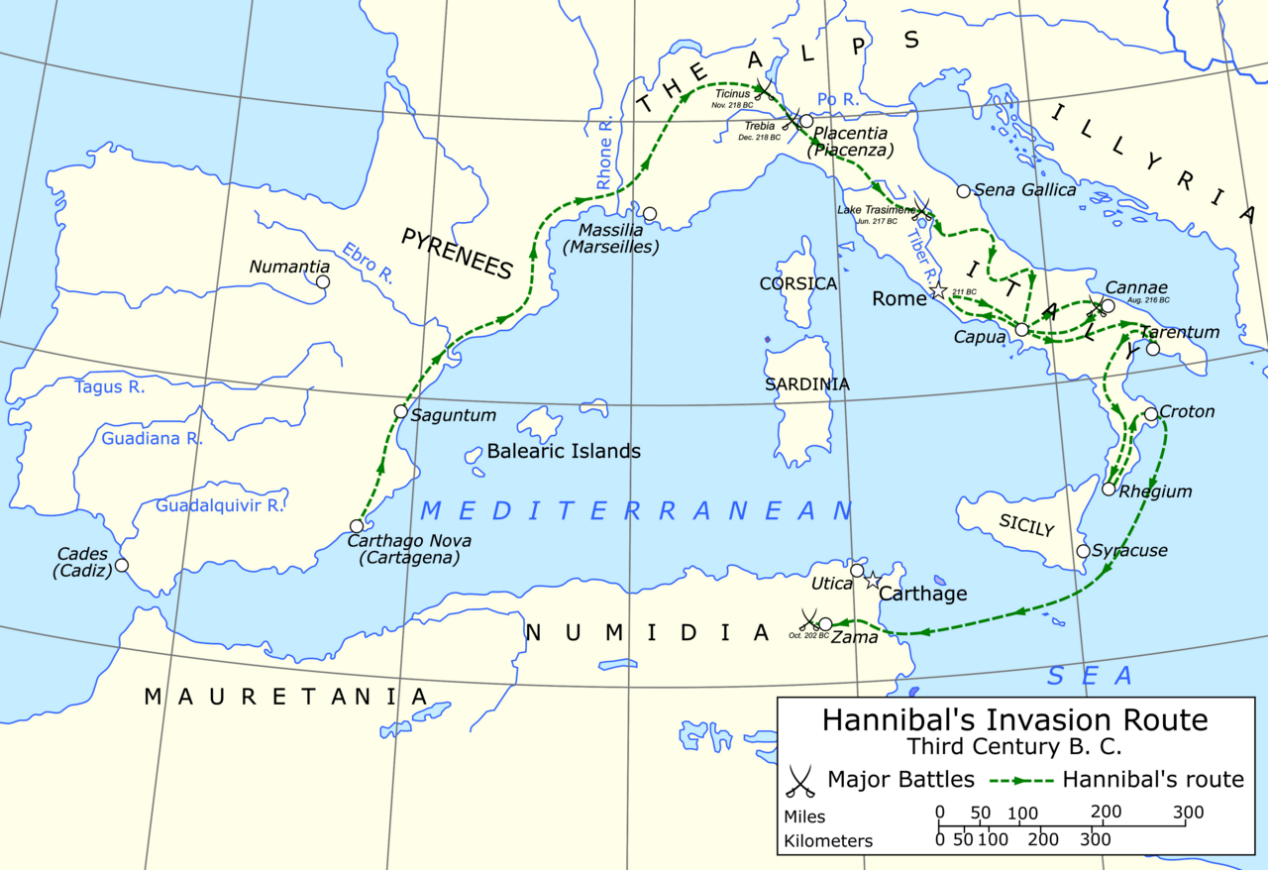
- Invasion from Spain to Italy in the 2nd Punic War
- 37 war elephants + 40,000 troops (incl. large cavalry)
- Supply of troops and beasts had to be realised in hostile territory
Supply chains in History
Toga praetexta: raw materials, purple and sales
Production process

| Product | Price |
|---|---|
| Simple white toga | 12 sesterces |
| Better white toga | 60 sesterces |
| Toga praetexta | 800 sesterces |
\(\rightarrow\) Annual pay of a common soldier: 1,000 sesterces
Raw material and sales map
Supply chains in History
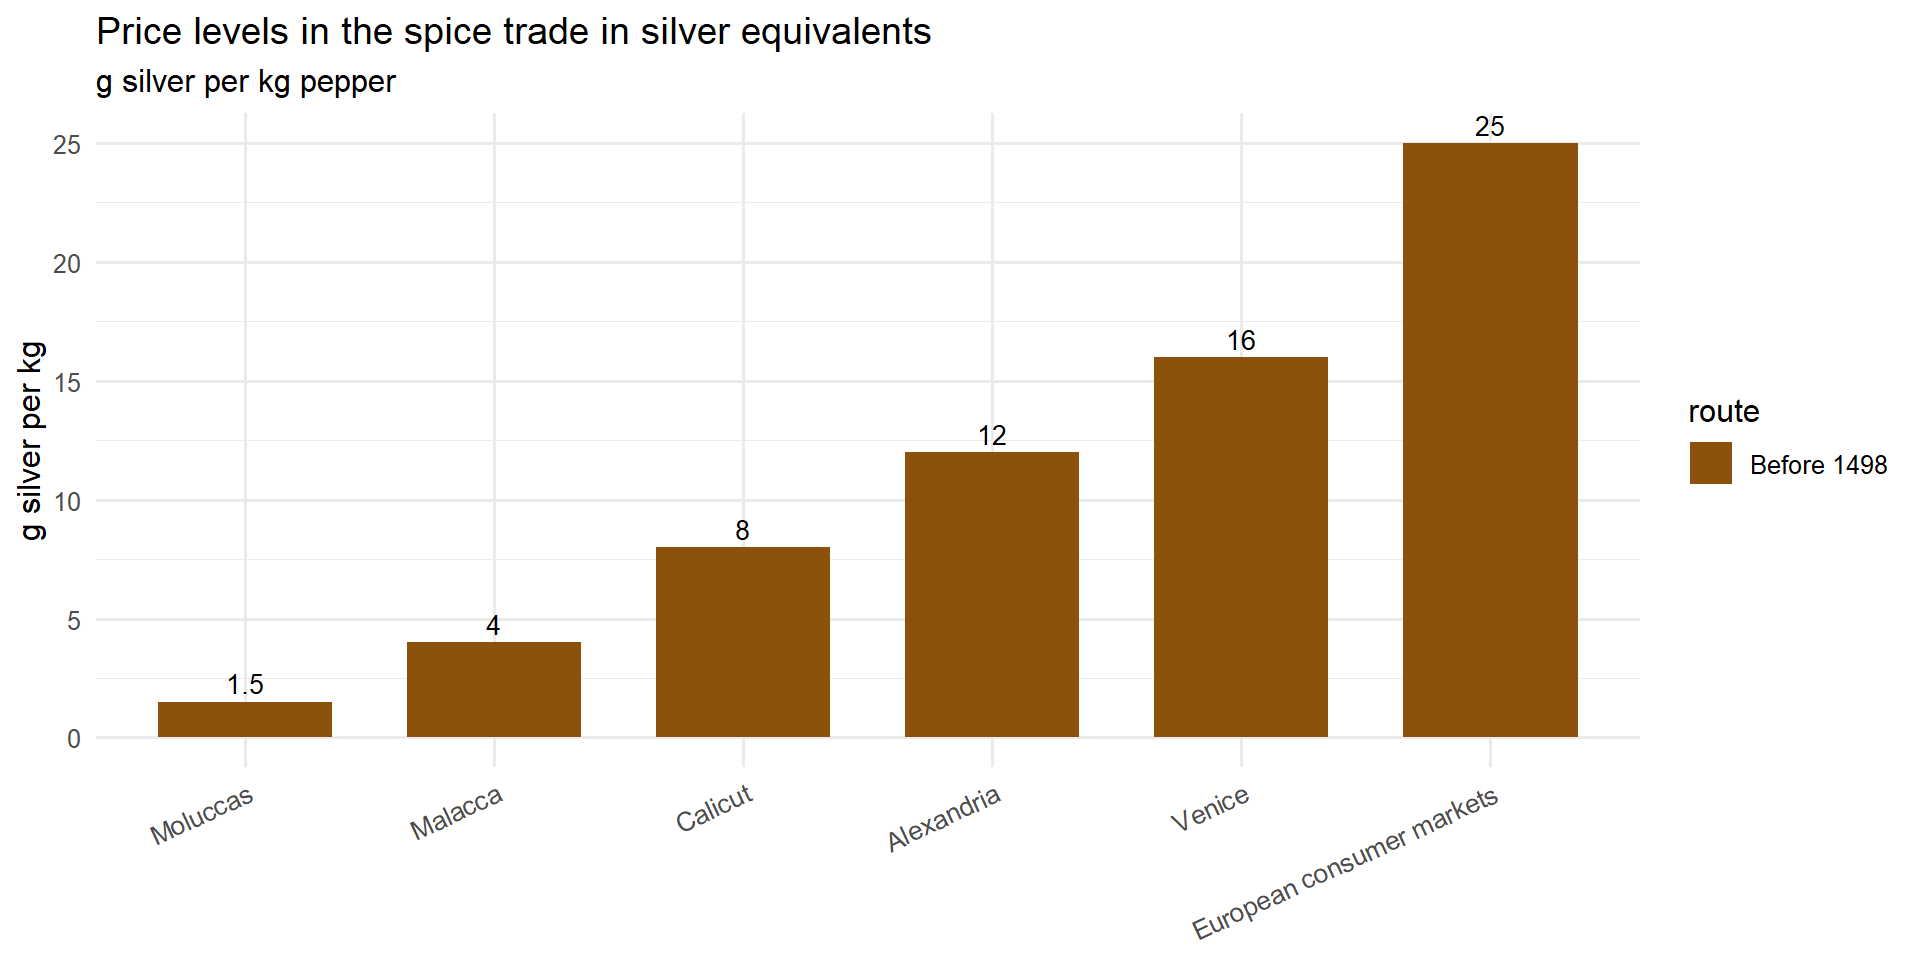
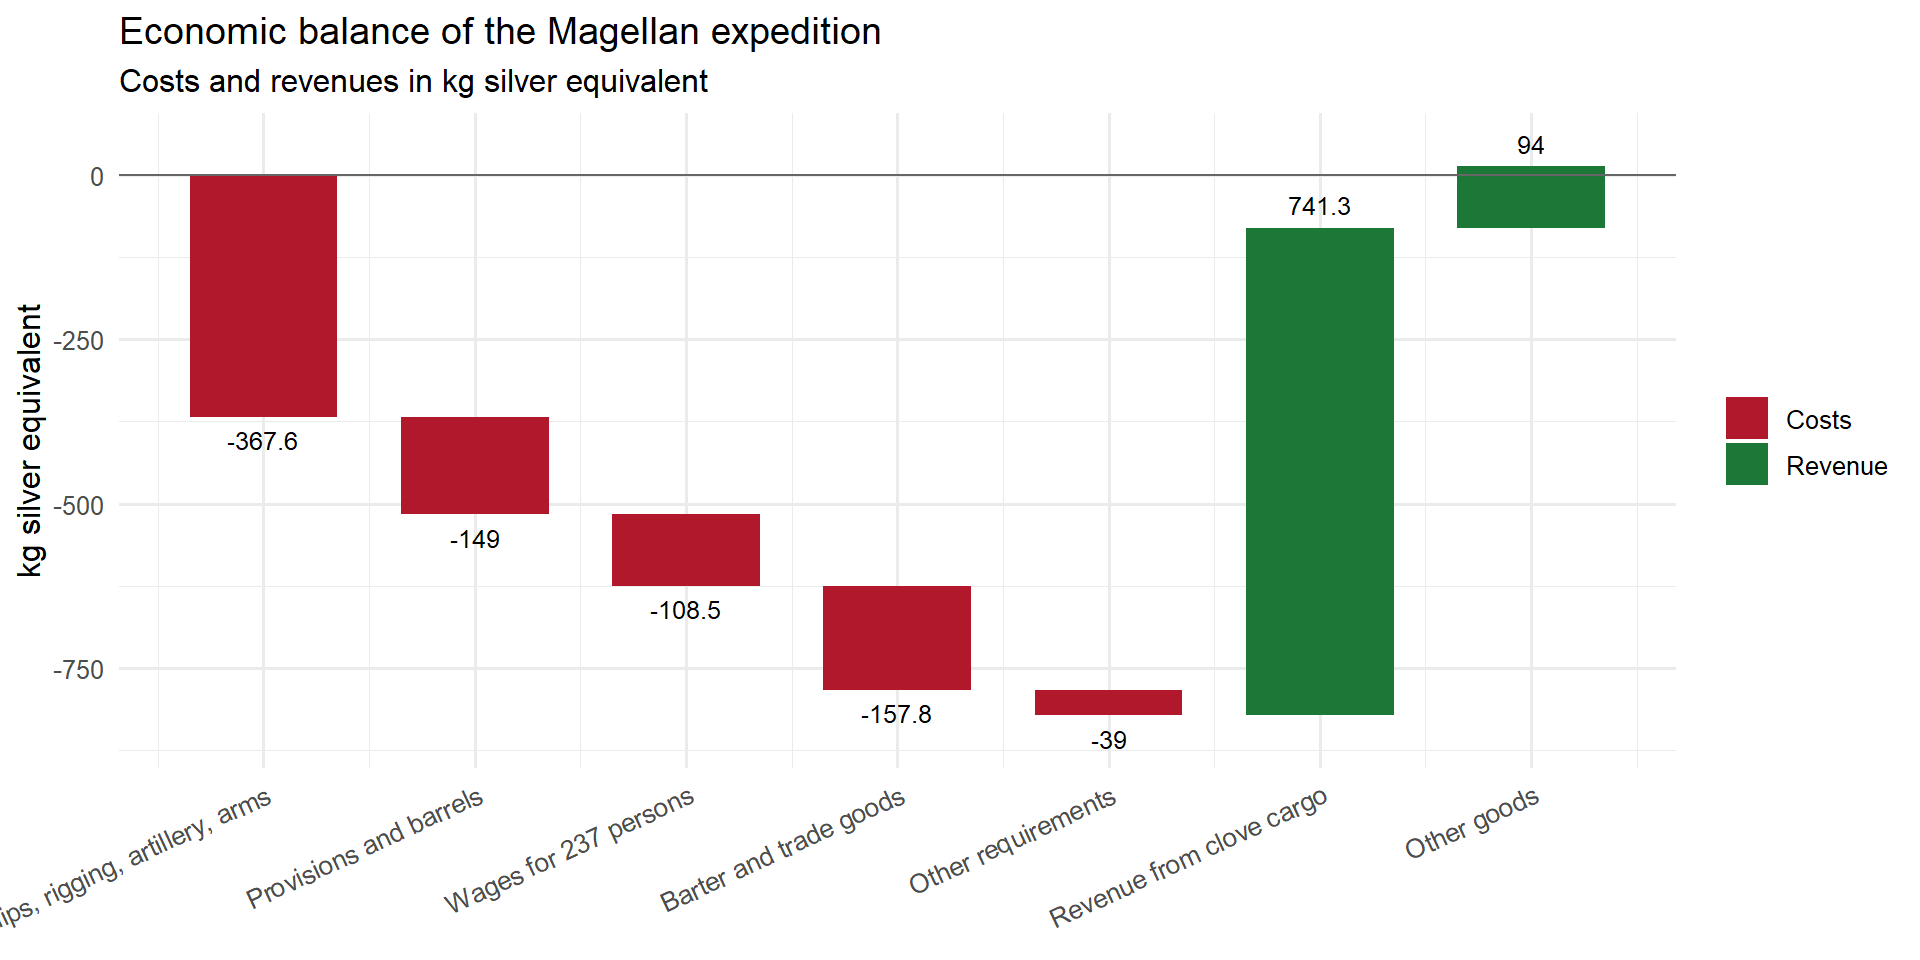
Spice trade in the 15th century
- Magellan expedition of the Spanish Crown, 1519 - 1522
- Goal: western sea route to the Moluccas
- Start: 5 ships / 260 crew
- End: 1 ship / 18 crew
Why Supply Chain Management?
Customer value along the supply chain
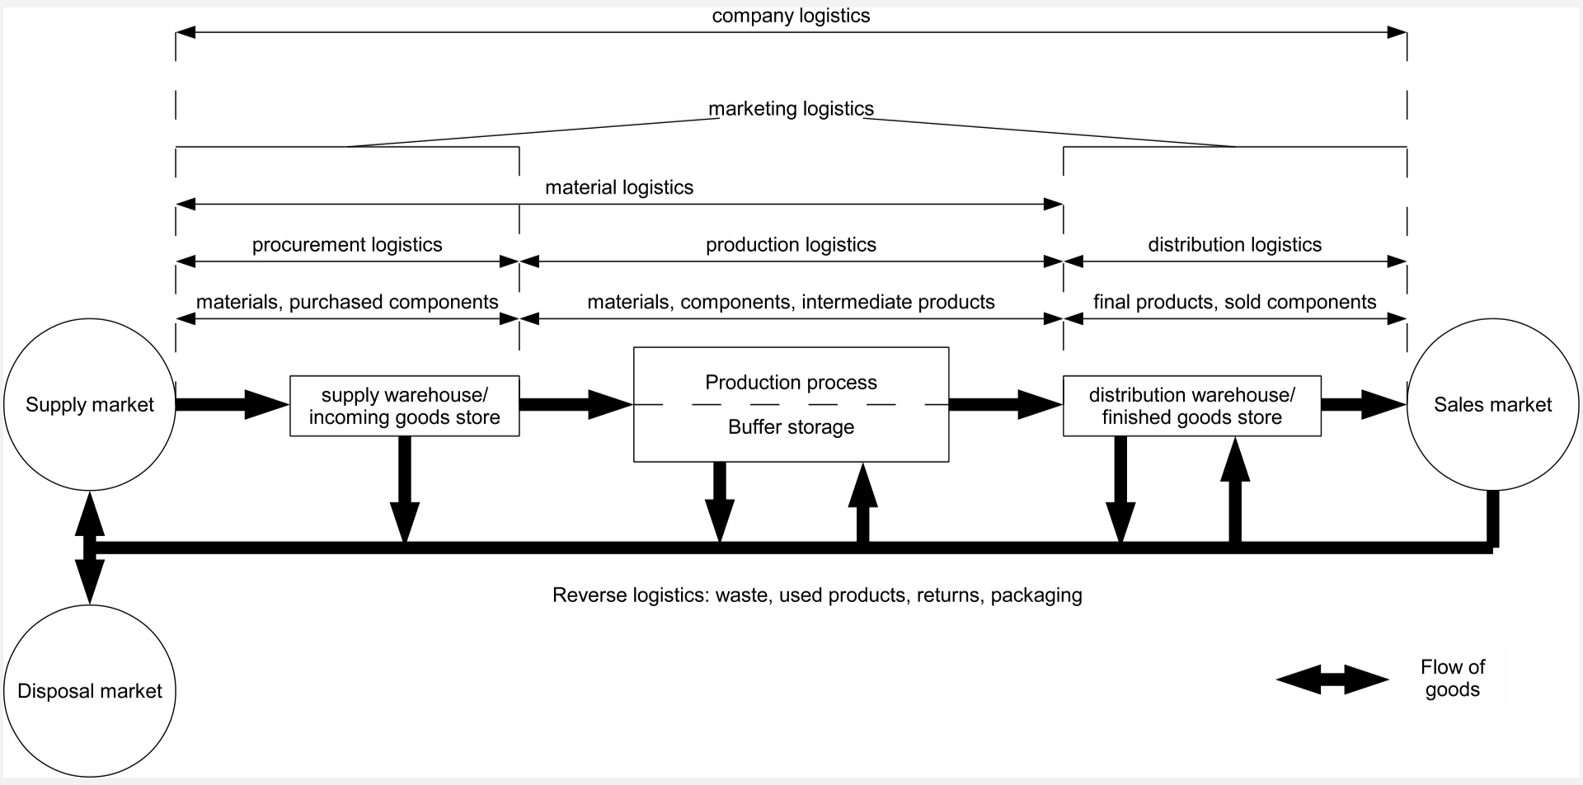
Logistics systems in the company
Supply chain structures
Network concept & basic paradigm
SCM profit = customer revenue – total costs of all processes/partners = sum of indiv. profits
\(\rightarrow\) Optimising indiv. profits does not, as a rule, optimise the SCM profit!
Transformation
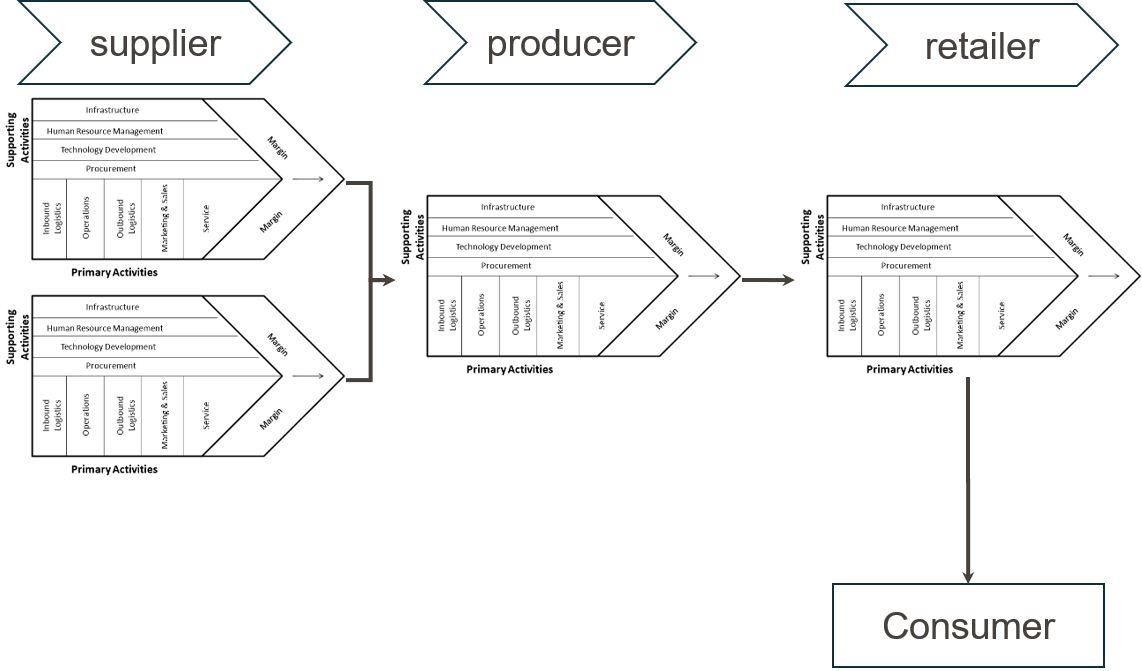
Value creation in the supply chain
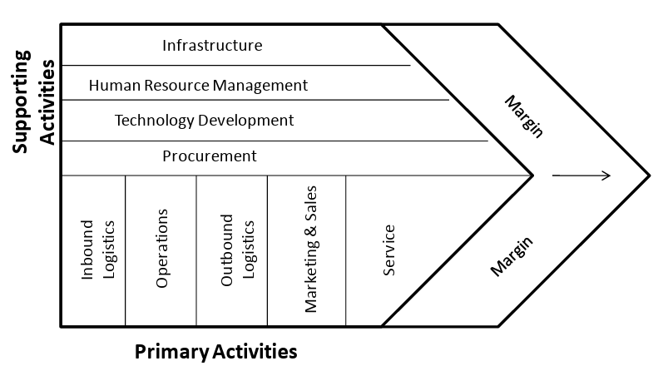
Porter’s value chain
Definitions of SCM
Diversity & common core
(Stadtler 2000, 9): “Supply chain management is the task of integrating organisational units along the supply chain, coordinating the flows of materials, information and money, and improving the competitiveness of the entire supply chain in order to meet customer needs.”
(Hugos 2018): “Supply Chain Management is coordination of production , inventory , location , transportation , and information among the participants in a supply chain to achieve the best mix of responsiveness and efficiency for the market being served .”
(Council of Supply Chain Management Professionals (CSCMP) 2013): “Supply chain management encompasses the planning and management of all activities involved in sourcing and procurement, conversion, and all logistics management activities. Importantly, it also includes coordination and collaboration with channel partners, which can be suppliers, intermediaries, third party service providers, and customers. In essence, supply chain management integrates supply and demand management within and across companies .”
Companies and their environment
Open model of the firm
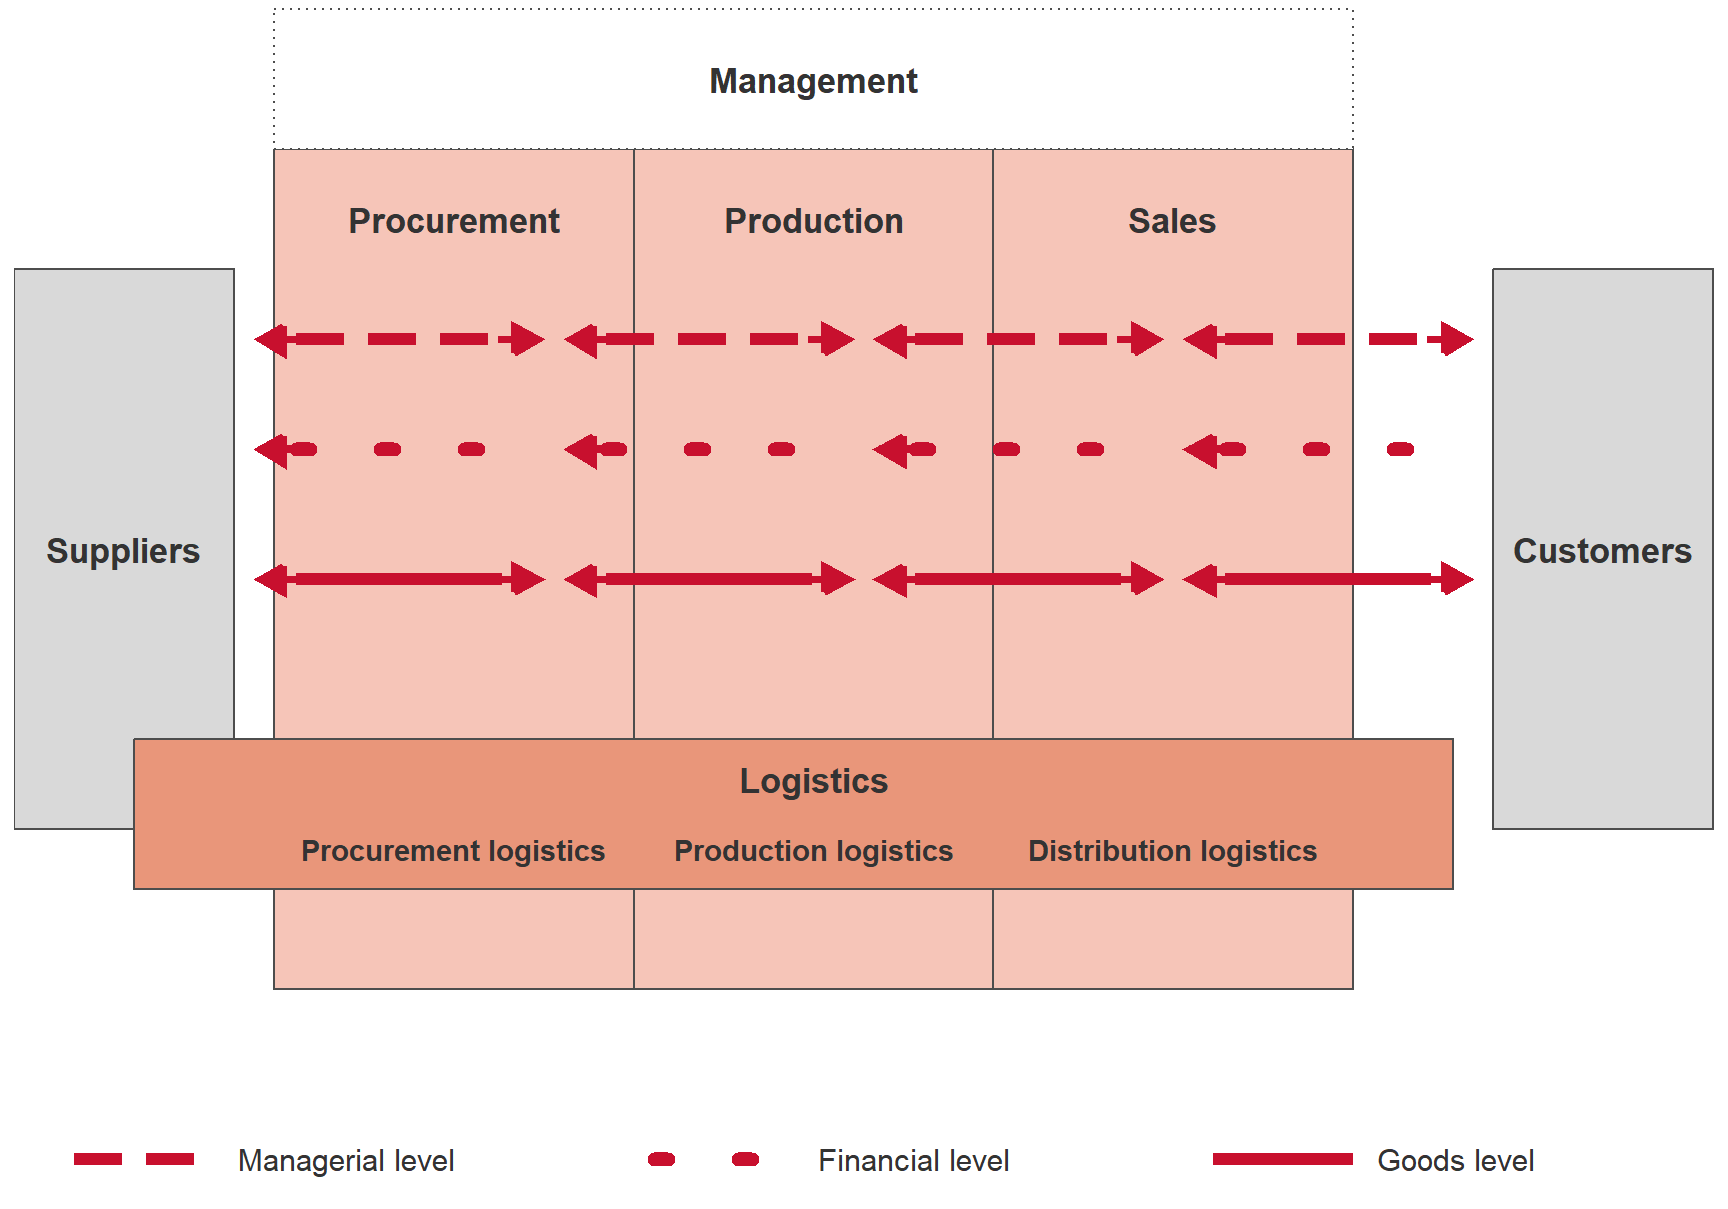
- Dispositive level: covers the information flow within and between companies, planning processes, decision-making and control (management in the narrow sense)
- Financial level: covers money and payment flows within and outside the company
- Goods level: covers the movement and stock of physical goods (raw materials, auxiliary materials and supplies) within and between companies
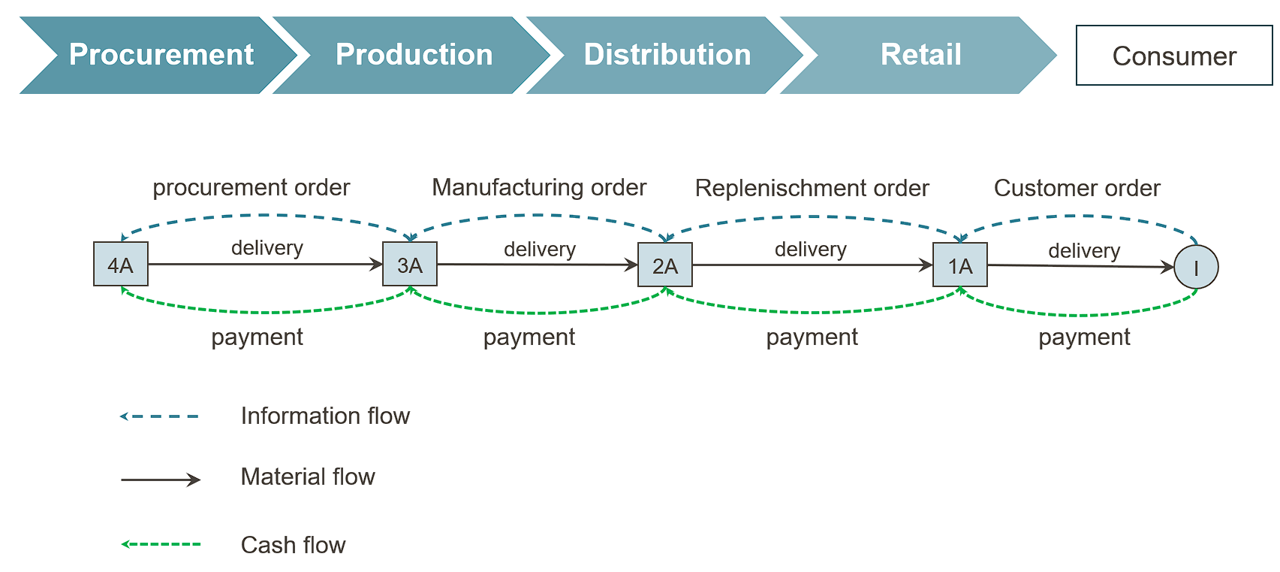
Flows in supply chains
Supply chain structures
Focal supply chain
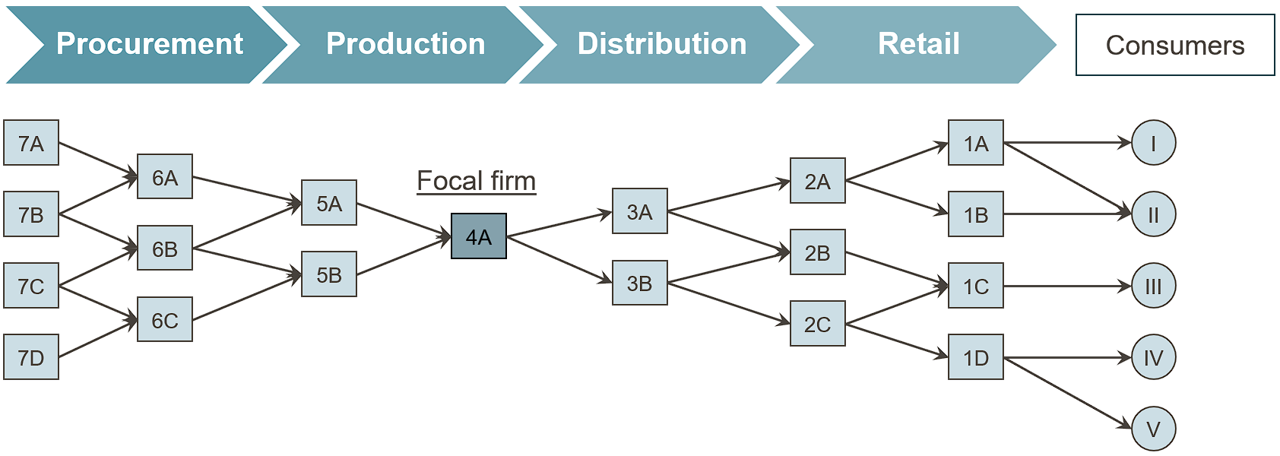
Characteristics:
- Focal company in the bottleneck position → “controls” the network (actors and structure)
- High market power → controls market access
- Often the coordinator → sets standards and strategic objectives
- Examples: automotive industry, Apple, …
Supply chain structures
Polycentric supply chains
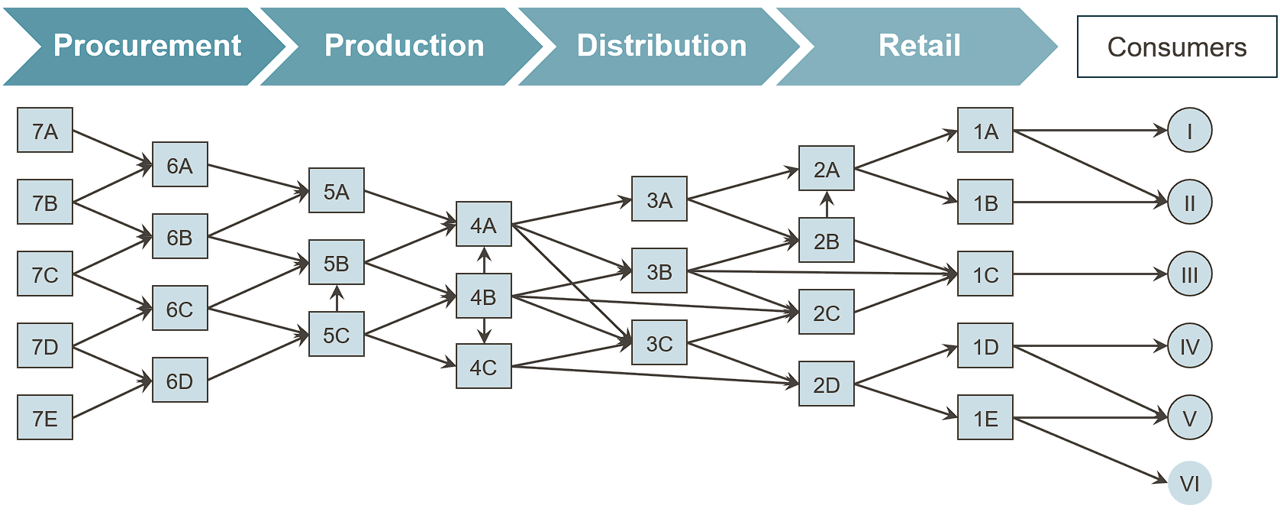
Characteristics:
- Distributed and overlapping competences
- Specialisation and cooperation
- No clear standardisation and a rather egalitarian distribution of market power
- Examples: IKEA, Neste, Unilever, …
Examples of supply chains
Task
Try to describe the structure of the supply chains, in particular the distribution structure, of the following products:
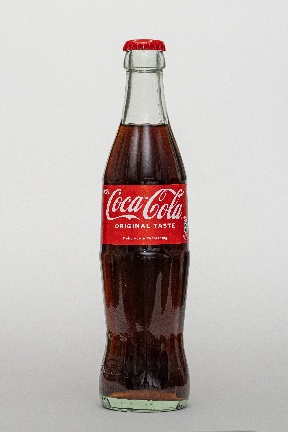
- A bottle of Coca-Cola (glass, 0.3 l)
- T-shirt from Patagonia
- Gravel bike Waldwiesel from Urwahn
- Ritter Sport Hazelnut
Describe the main production steps by specifying the raw materials, materials and components used as well as the (intermediate) product(s) created. Complement the description by specifying the logistics processes that link the production stages.
Assign the individual process steps (production and logistics) to locations.



Fundamentals of SCM - Objectives & Trade-offs
Fundamentals of Supply Chain Management
- Tasks, terms and concepts
- Objectives & trade-offs
- Costs & management
Learning objectives
After this unit you will be able to …
- structure value creation processes and the key drivers of a supply chain,
- explain the terms responsiveness and efficiency,
- contrast the implied uncertainty of a market with the responsiveness of a supply chain,
- assess the strategic fit of a supply chain configuration.
Further reading
- Strategic fit, supply chain drivers and implied uncertainty: (Chopra and Meindl 2025, chaps. 2–3).
- Matching supply with demand and operational capability: (Cachon and Terwiesch 2024, chaps. 1–3).
- Supply chain strategy and value-oriented logistics: (Christopher 2023, chaps. 2–4).
Value creation as a process

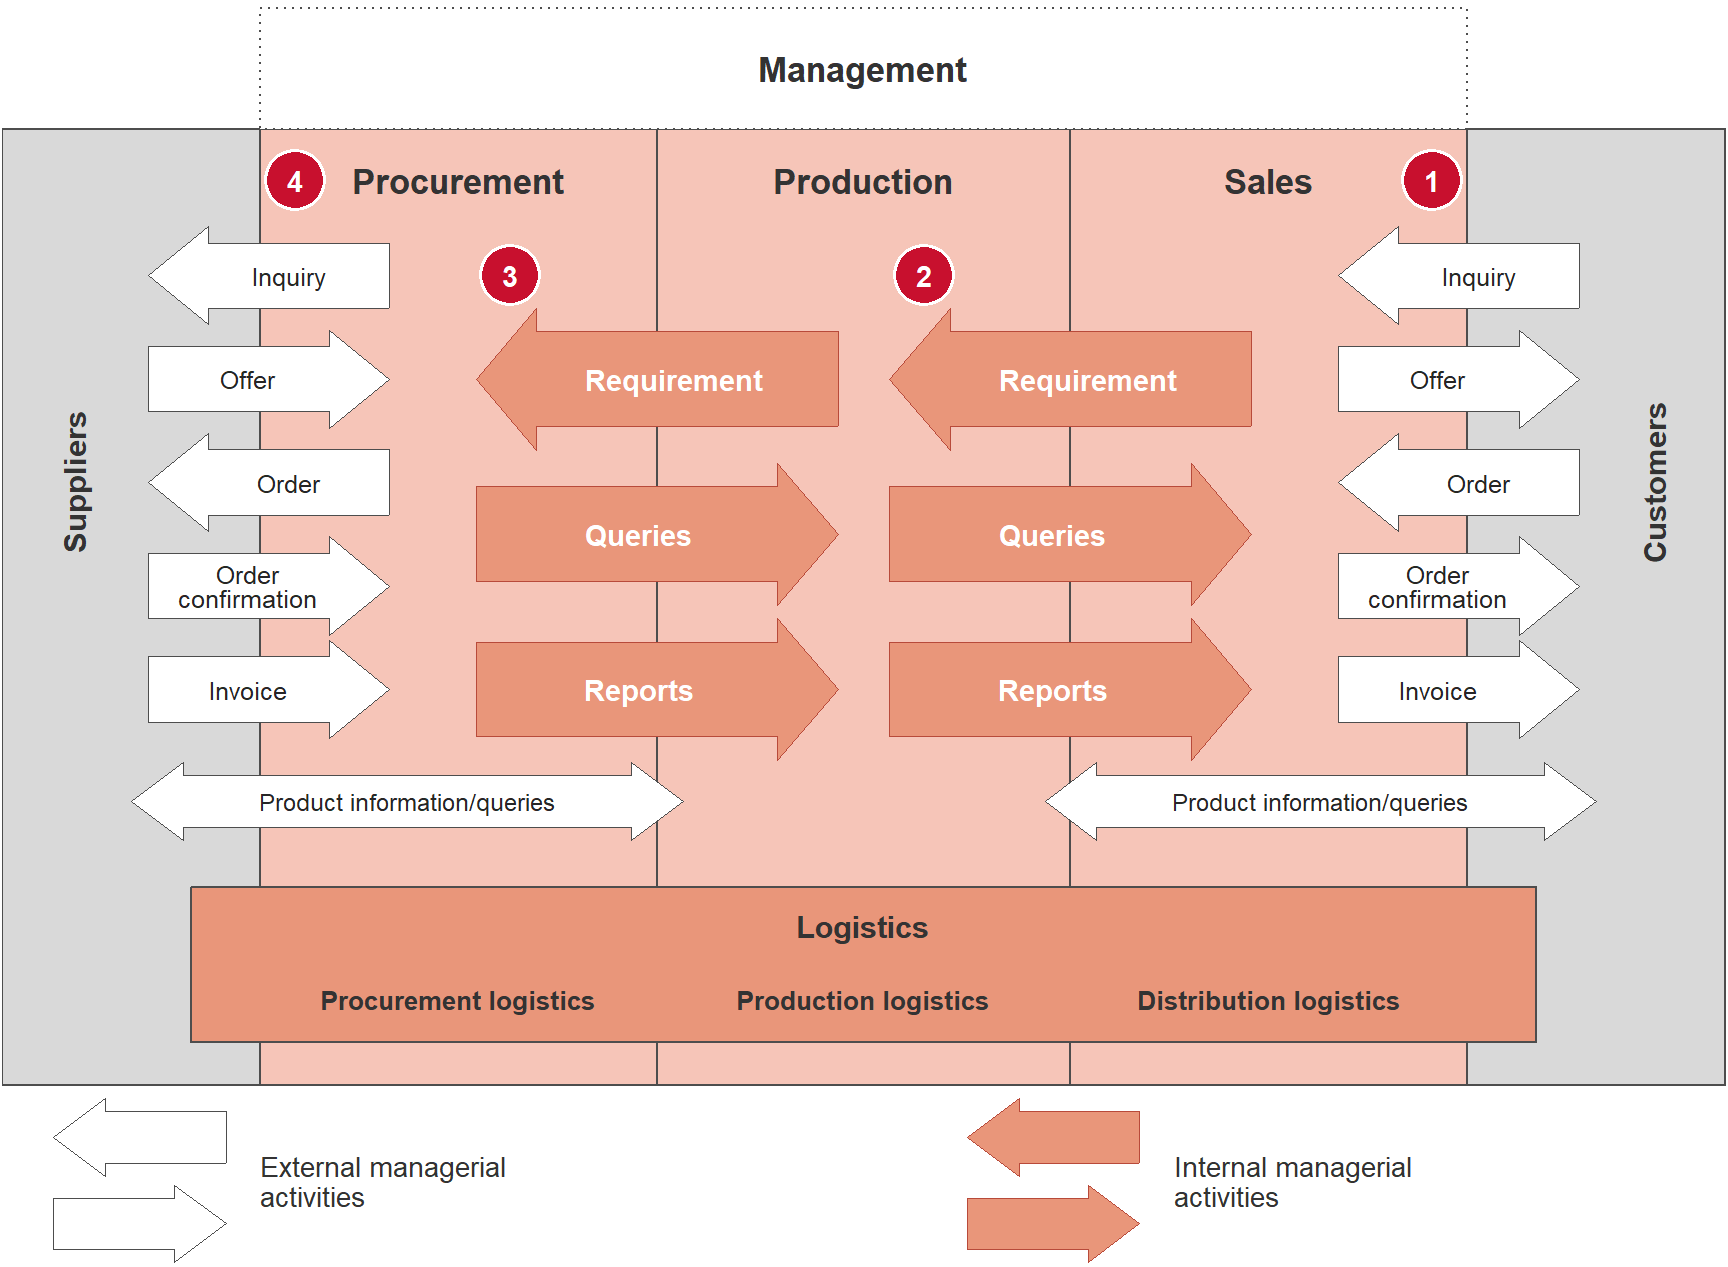
Procurement is the process of purchasing and providing raw materials, components and services from external partners that are required for the production of goods and services.
Production is a purposeful process of combining goods and services into higher-value products.
Distribution covers the physical distribution of goods from the manufacturer to the end customer and includes warehousing, transport and logistics of finished products.
Sales is the process of selling the end products to consumers or trading partners.
Strategic manufacturing
Decoupling point & manufacturing strategies
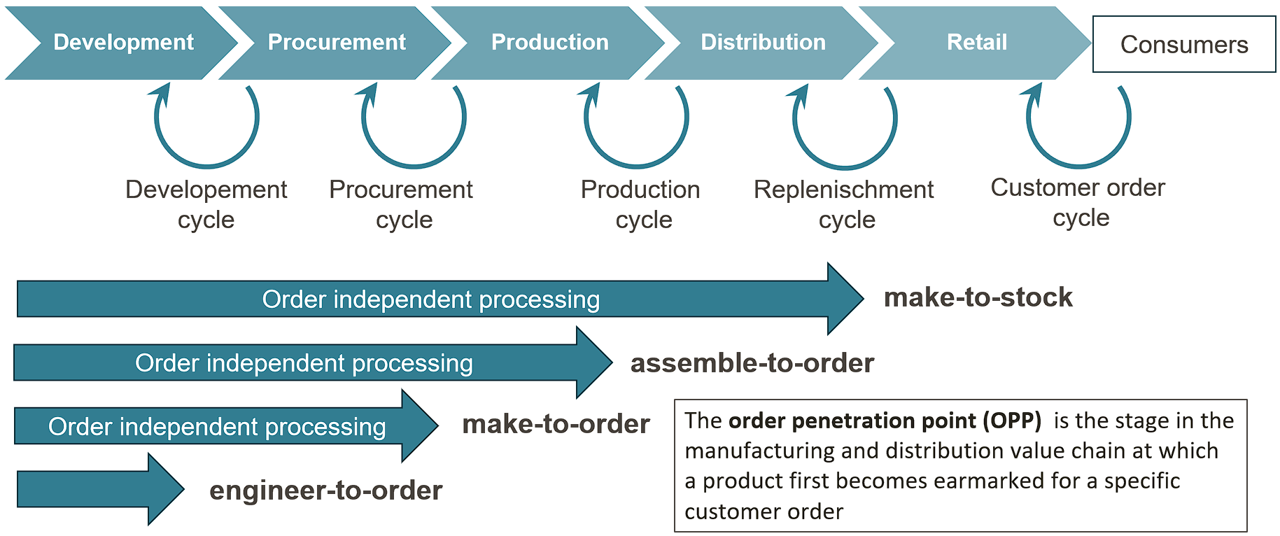
Strategic manufacturing
Thinking in cycles
Customer order cycle: processing of external customer demand
Distribution/replenishment cycle: conversion of customer demand into internal demand for finished products
Production cycle: conversion of internal demand into production requirements for intermediate products and raw materials
Procurement cycle: design of ordering/supply processes for raw materials and services that have to be sourced externally
Strategic manufacturing
Decoupling of cycles
Make-to-stock
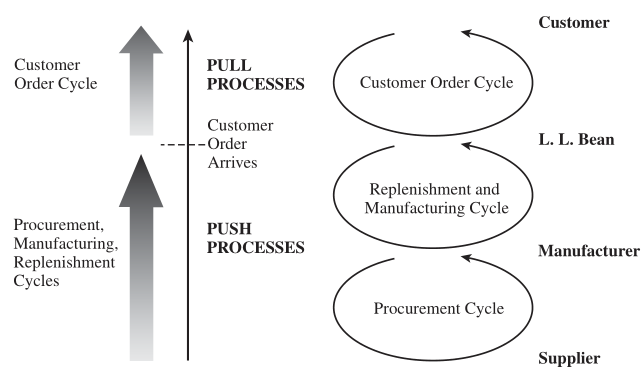
Examples: grocery retail, drugstores, …
Make-to-order
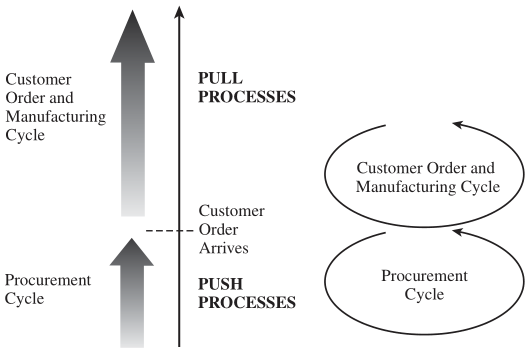
Examples: buildings, aircraft, paintings
Strategic objectives
Customer satisfaction – meeting customer expectations
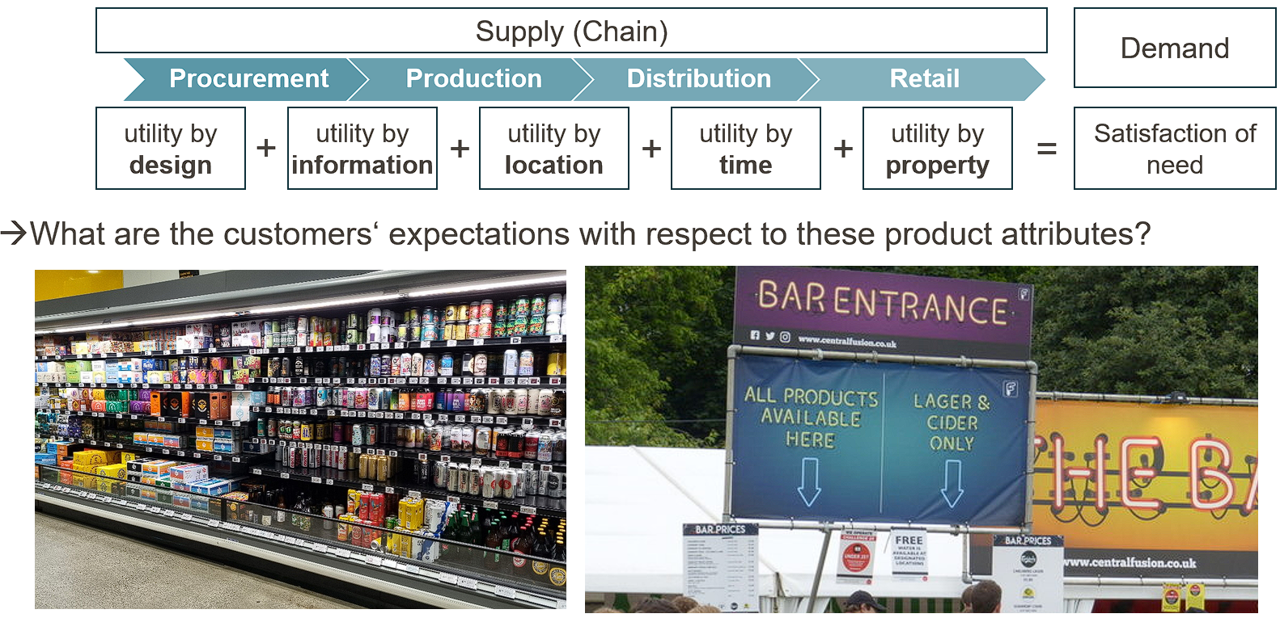
Strategic objectives
Customer satisfaction & uncertainty

Customers and supply chain uncertainty
- Quantity demanded per customer order
- Lead time accepted by customers
- Expected product variety
- Expected service level
- Price/willingness to pay
- Degree of product innovation
Demand uncertainty
Uncertainty of the demand for a product
Implied demand uncertainty
Uncertainty of the demand segment that the supply chain is intended to serve, based on the defined demand attributes
Dealing with uncertainty
Customer needs & implied uncertainty
| Customer needs | Causes implied uncertainty because … |
|---|---|
| (Max.) demand quantities increase | Wider range of demand causes greater variance / fluctuation of demand quantities |
| Lead time decreases | Less time remains to react to demand fluctuations |
| Number of products offered increases | Demand for individual products is harder to forecast |
| Required service level increases | Demand peaks now have to be absorbed |
| Degree of innovation increases | Demand for new products is usually unknown or hard to forecast |
| Number of sales channels increases | Demand per sales channel is harder to forecast |
Dealing with uncertainty
Roles & risk allocation in the supply chain
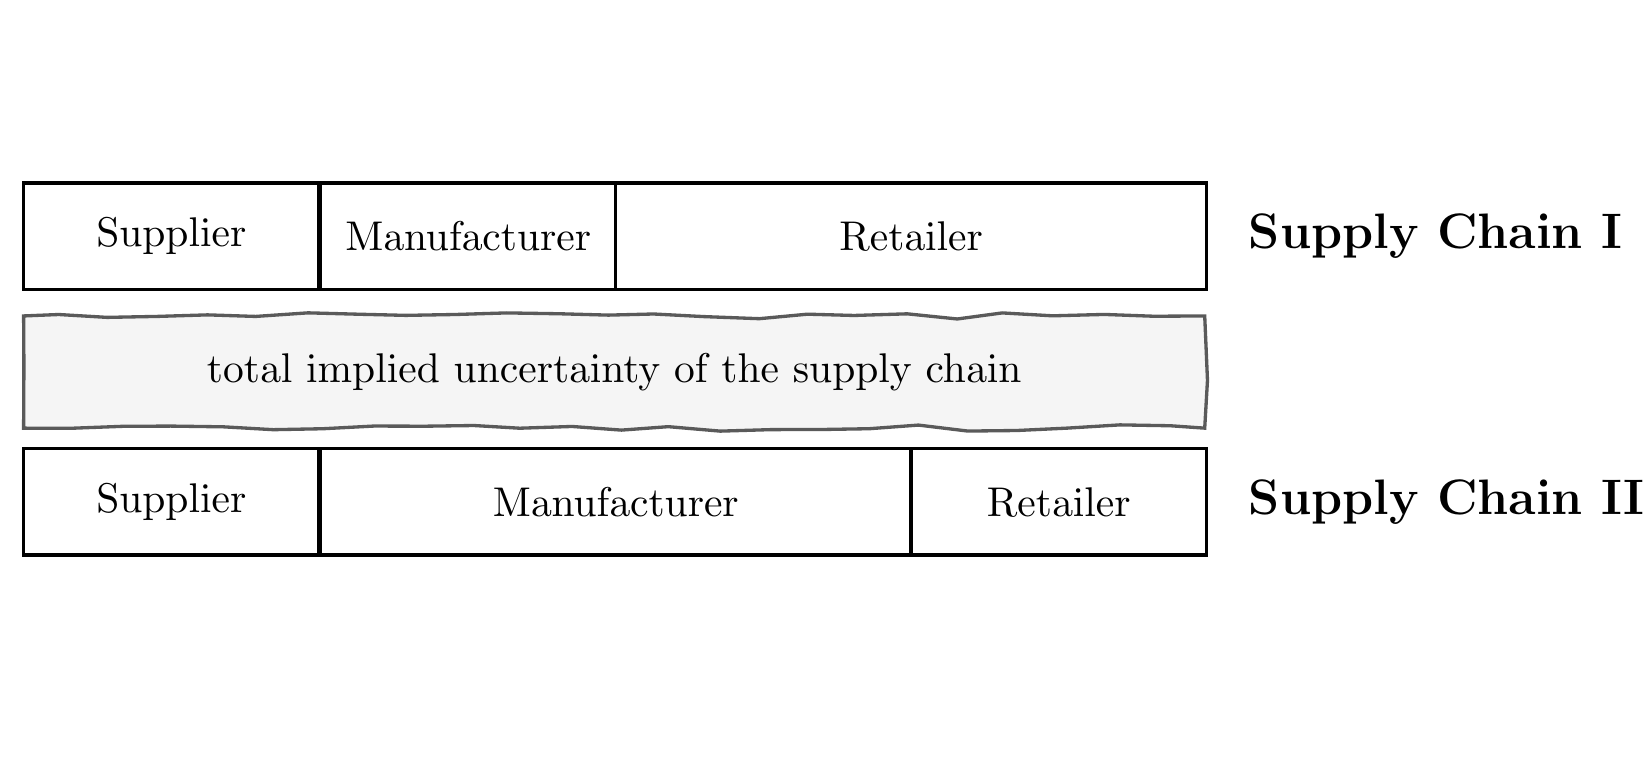
Dealing with uncertainty
Responsiveness
Responsiveness
is the ability of a supply chain to deal with demand uncertainty
Responsiveness can be achieved, among other things, through:
- High inventory levels
- Short response/lead times
- High product variety
- Short development cycles for new products
- High service levels
- Reduction of supply uncertainties
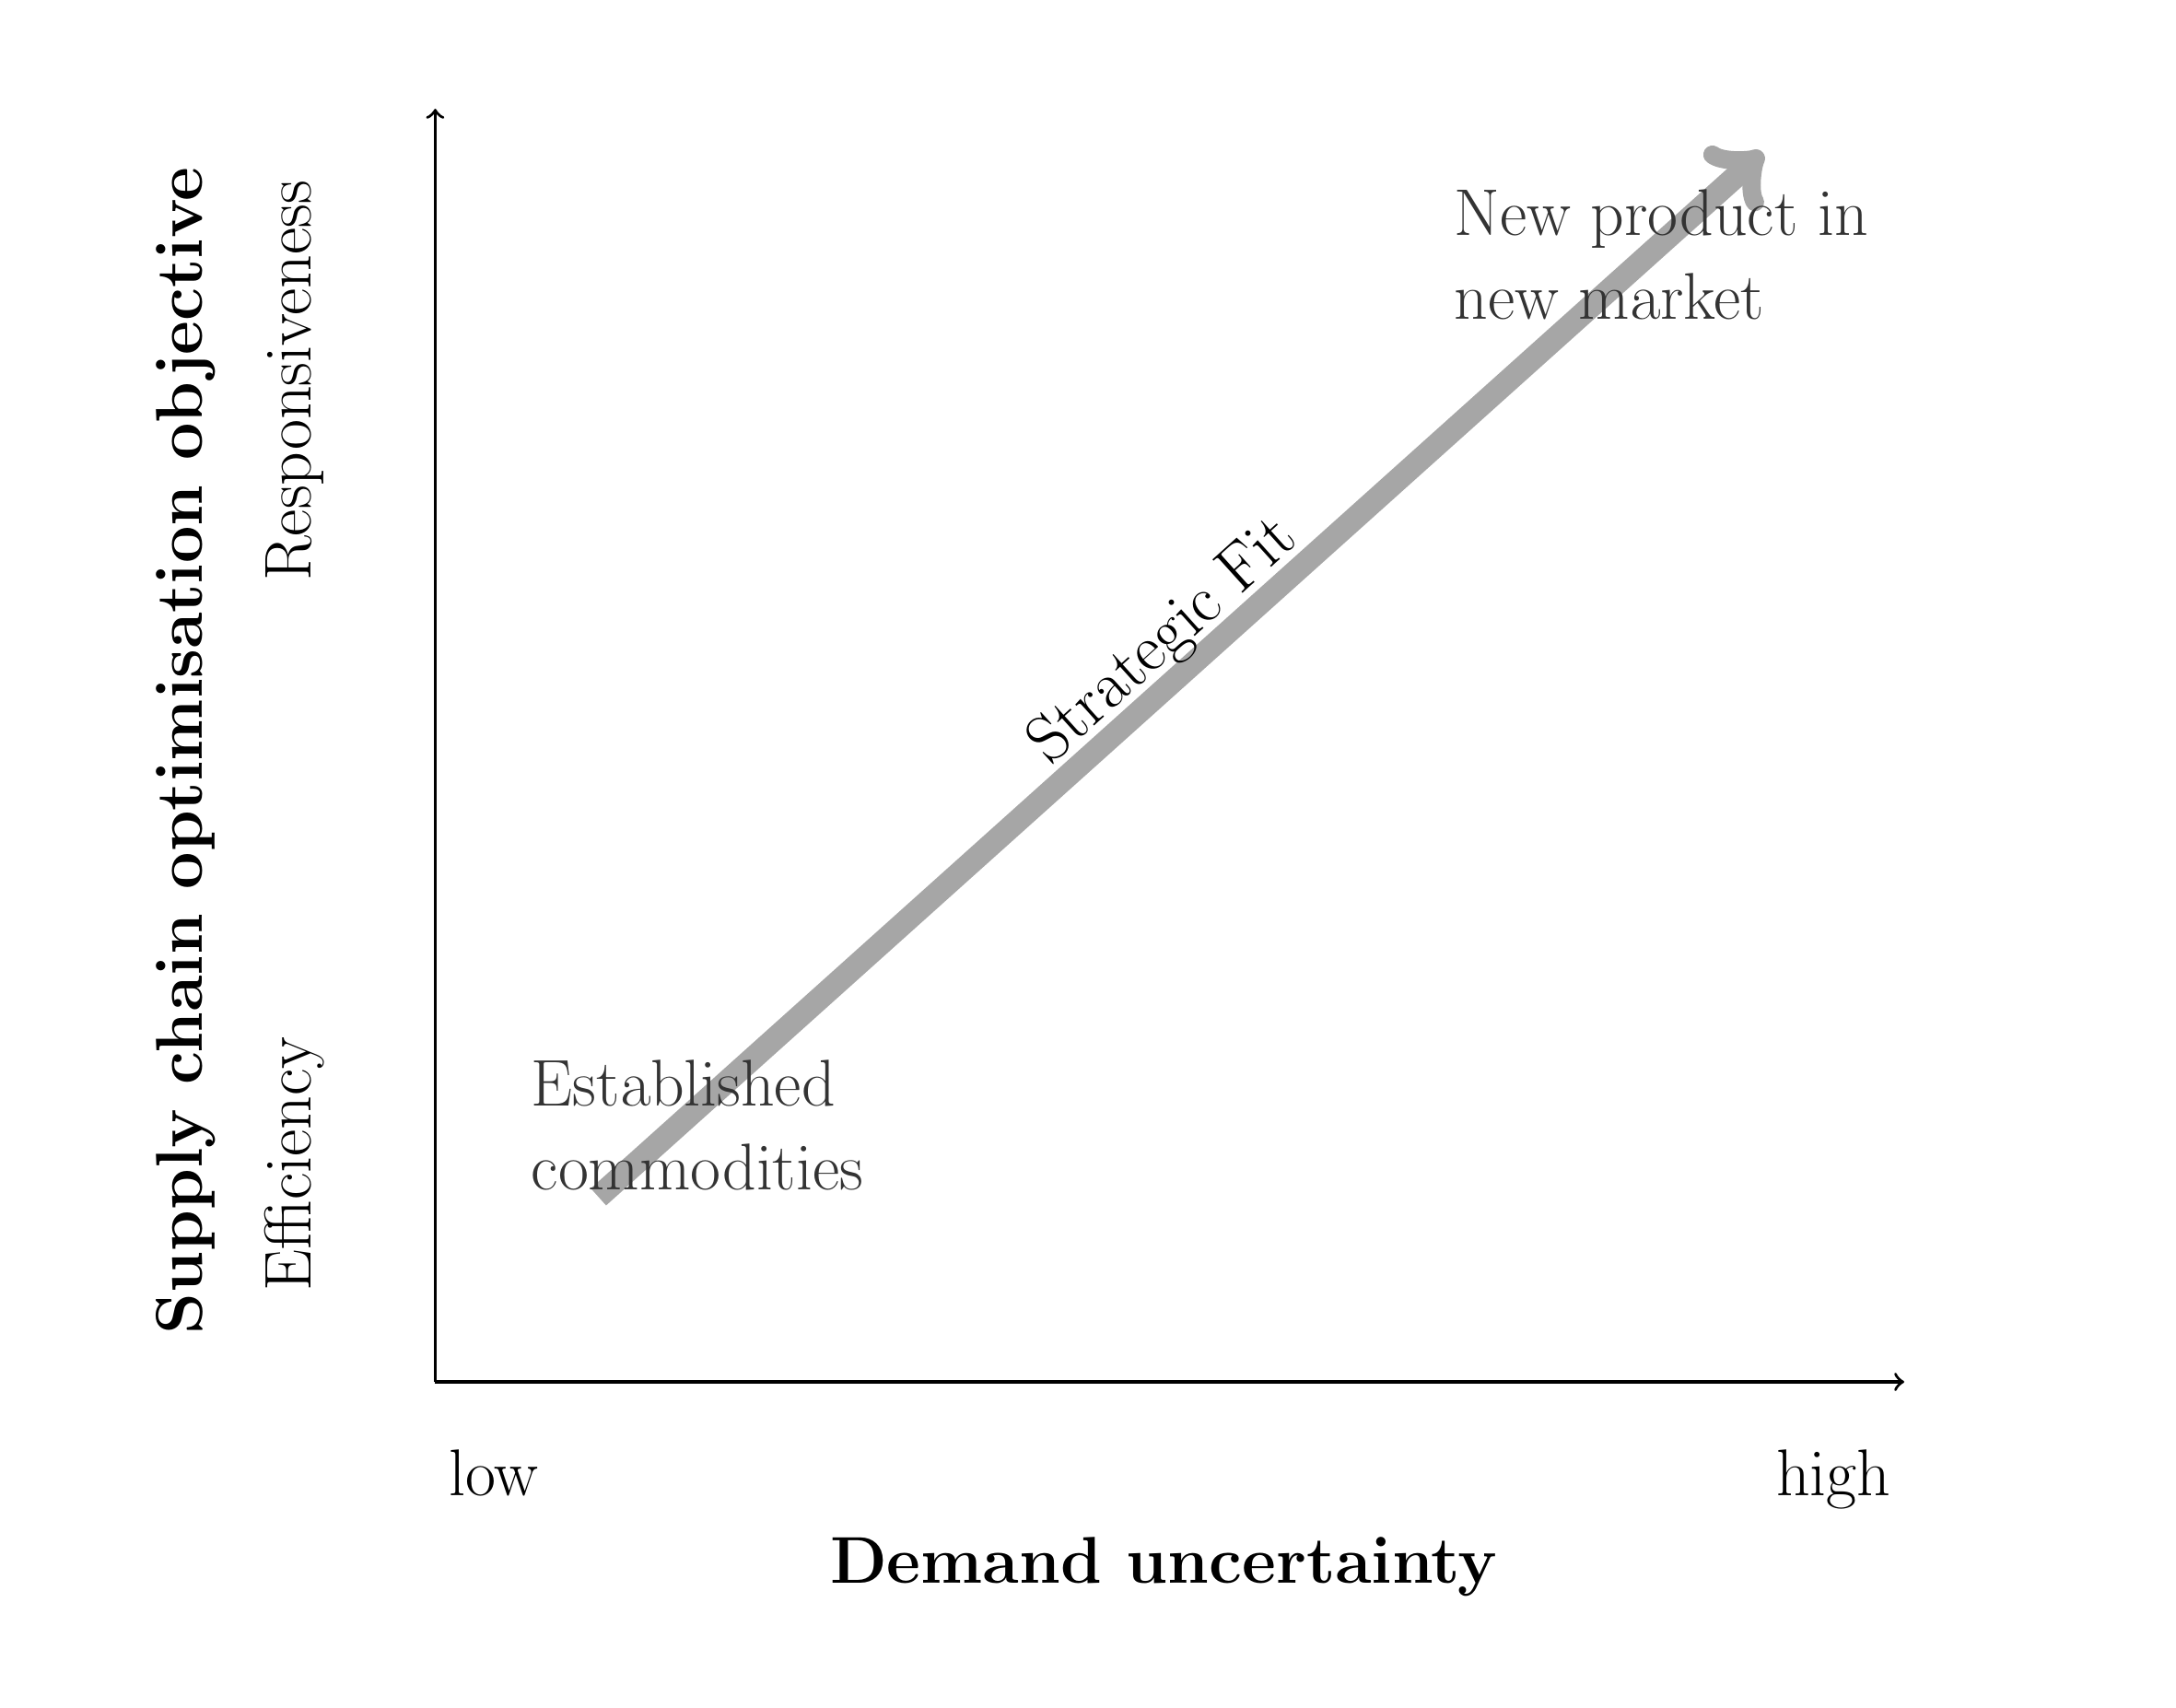
Strategic objectives
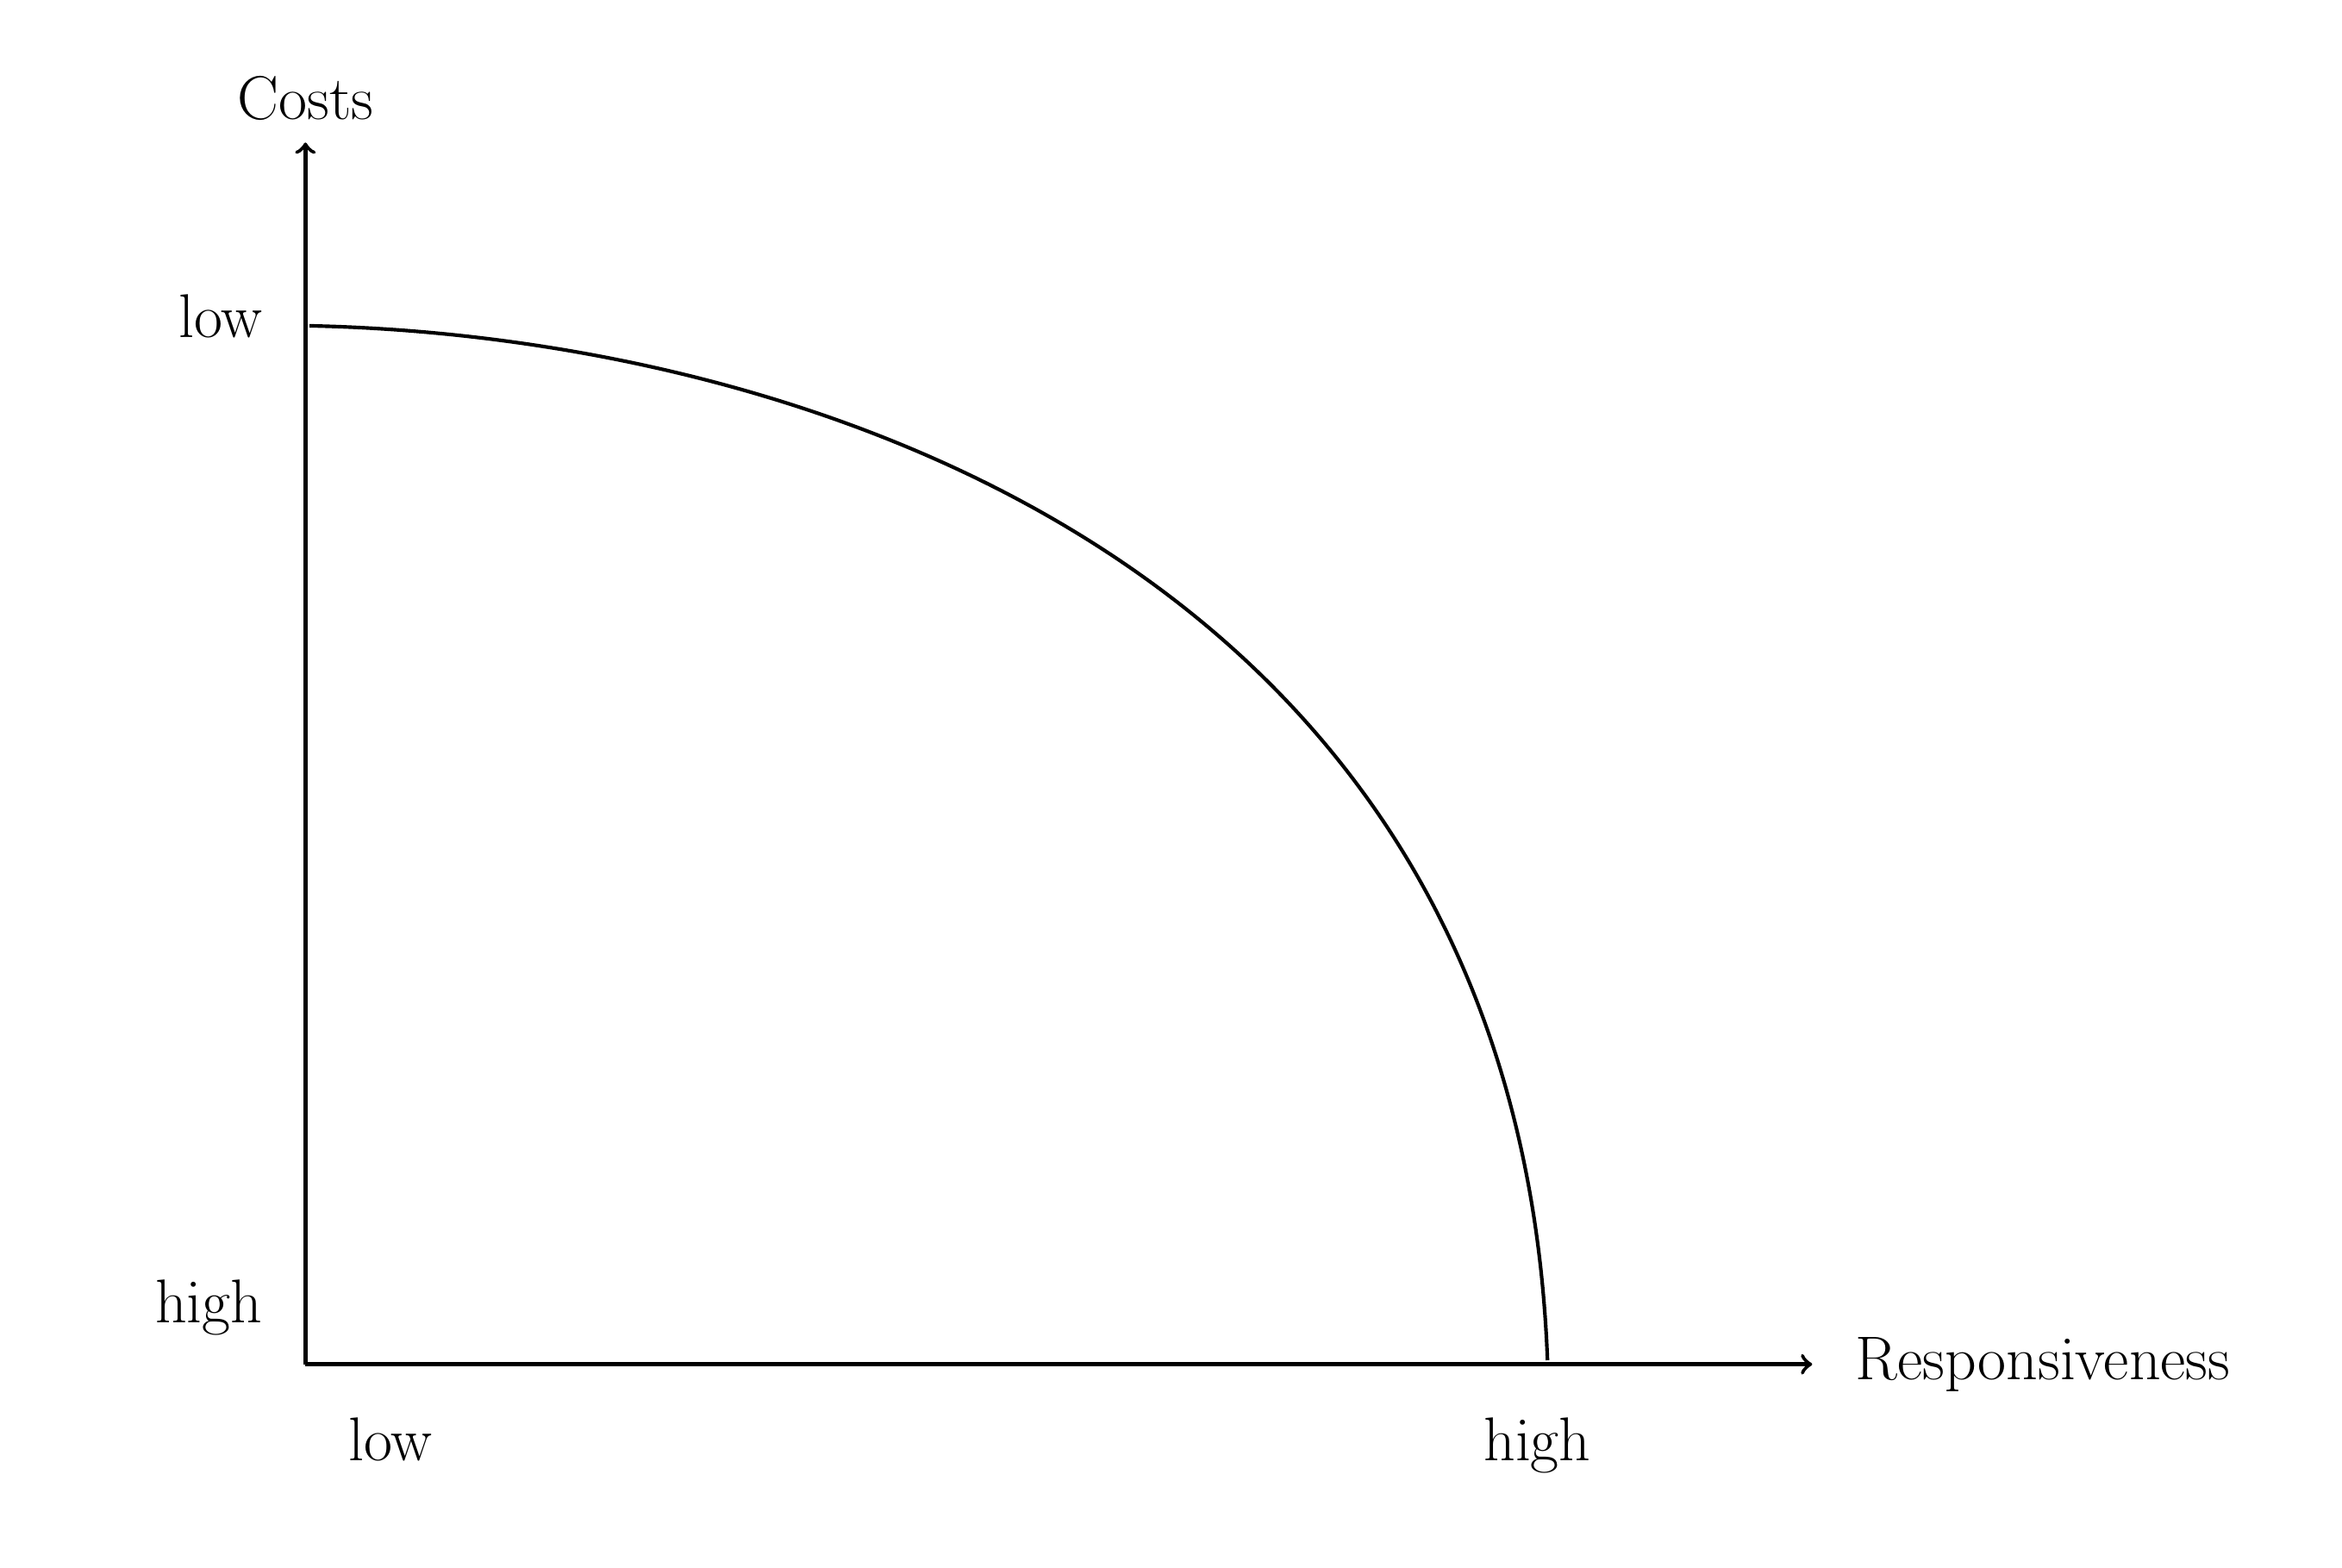
Responsiveness vs. efficiency
Responsiveness
The responsiveness of a supply chain is the ability of a supply chain to deal with demand uncertainty
Strategic drivers

\(\rightarrow\) Responsiveness causes costs!
Efficiency
The efficiency of a supply chain is the inverse of the total costs of a supply chain, i.e. of all costs of a product from
Strategic management
Supply chain drivers

Figure 3
- Production technology
- Product portfolio
- Vertical integration
- Transport modes
- Storage capacities
- Safety stocks
- Supplier selection
- Facility capacities
- Stages & links
- Pricing
- Demand management
- Discounting
- Information sharing
- System integration
- Collaborative forecasting & planning
Strategic management
Sub-strategies
| Efficient supply chains | Responsive supply chains | |
|---|---|---|
| Primary objective | Meet demand at the lowest cost | Meet demand as quickly as possible |
| Product design strategy | Low product variety, focus on simple design and high throughput | Modular product development and postponement |
| Pricing strategy | Low prices and margins since customers are price-sensitive | Higher prices with higher margins, since customers are not very price-sensitive |
| Manufacturing strategy | High machine utilisation | Spare capacity to be able to expand production quantities at short notice |
| Inventory strategy | Minimise (safety) stocks | Build up safety stocks to buffer demand fluctuations |
| Lead time strategy | Reduce cycle times as long as costs do not increase | Reduce cycle times even if costs increase |
| Procurement strategy | Supplier selection based on cost and reliability | Supplier selection based on responsiveness, speed, flexibility and quality |
Strategic management
Generic strategies & SCM
| Generic strategy | Advantage | Basis of competition | Contribution of SCM |
|---|---|---|---|
| Cost leader | Drive cost-efficient production | Lowest prices in the product category | Efficient, low-cost infrastructure |
| Innovation leader | Exploit market strength and deploy unique technology | Generate sought-after and innovative products | Secure short time-to-market, increase volume |
| Service leader | Tailor service consistently to customers | Meet customer-specific expectations | Enable customer-oriented development |
| Quality leader | Manufacture safe and reliable products | Unique product features | Reliable SC, quality assurance |
| Sustainability leader | Sustainable products and processes | Meet customers’ sustainability expectations | CO2 neutrality, conservation of energy and resources |
SCM Fundamentals – Costs & Management
Fundamentals of Supply Chain Management
- Tasks, terms and concepts
- Objectives & trade-offs
- Costs & management
Learning objectives
After this unit you will be able to …
- name the key economic, ecological and social objectives of supply chain management,
- analyse trade-offs between service, inventory, transport, costs and sustainability,
- explain and quantify the main components of logistics costs,
- select and interpret suitable metrics for evaluating logistics decisions.
Further reading
- Systems of objectives and cost models: (Günther and Tempelmeier 2012, chaps. 1–3).
- Performance and cost perspective of distribution logistics: (Tripp 2024, chaps. 1–4).
- Sustainability as a corporate objective: (Dyckhoff et al. 2008, chaps. 1–3).
Types of objectives in the company
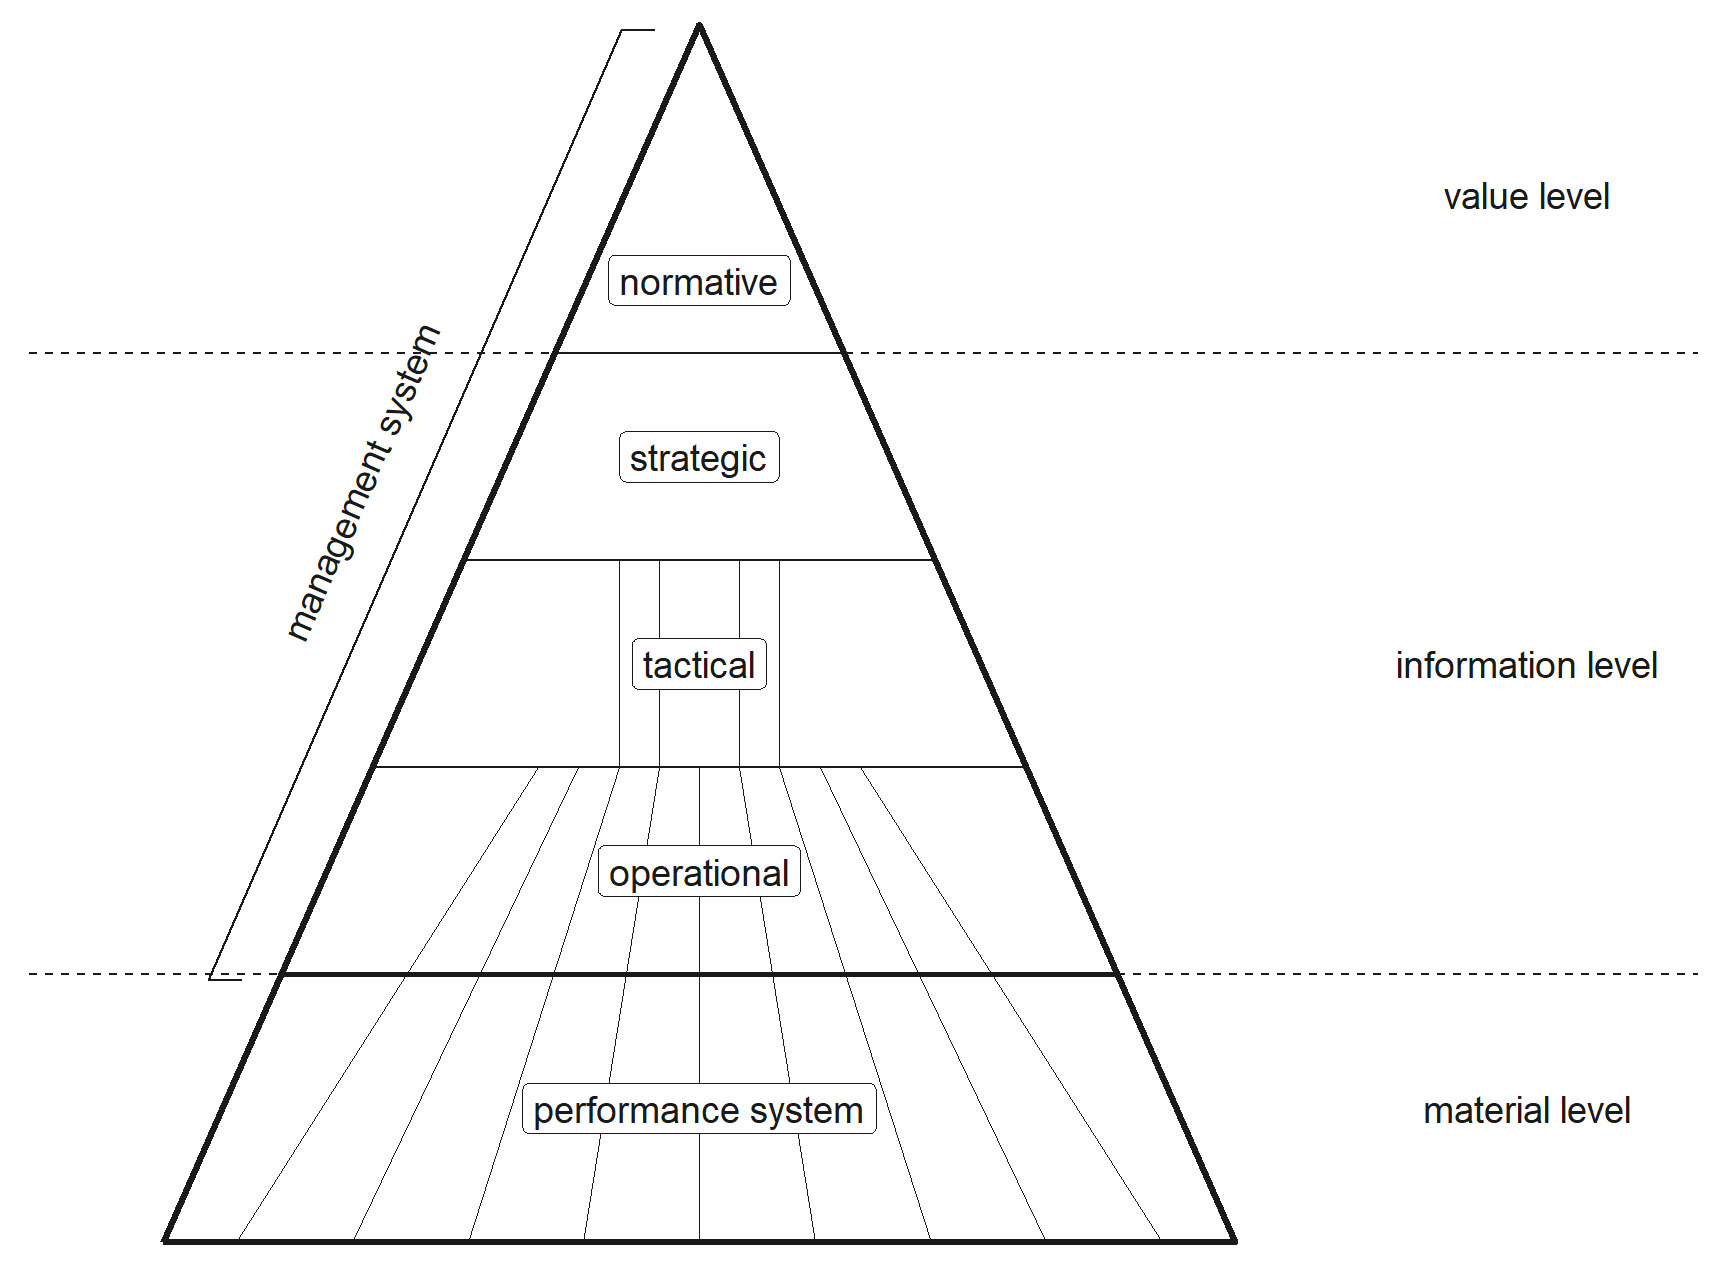
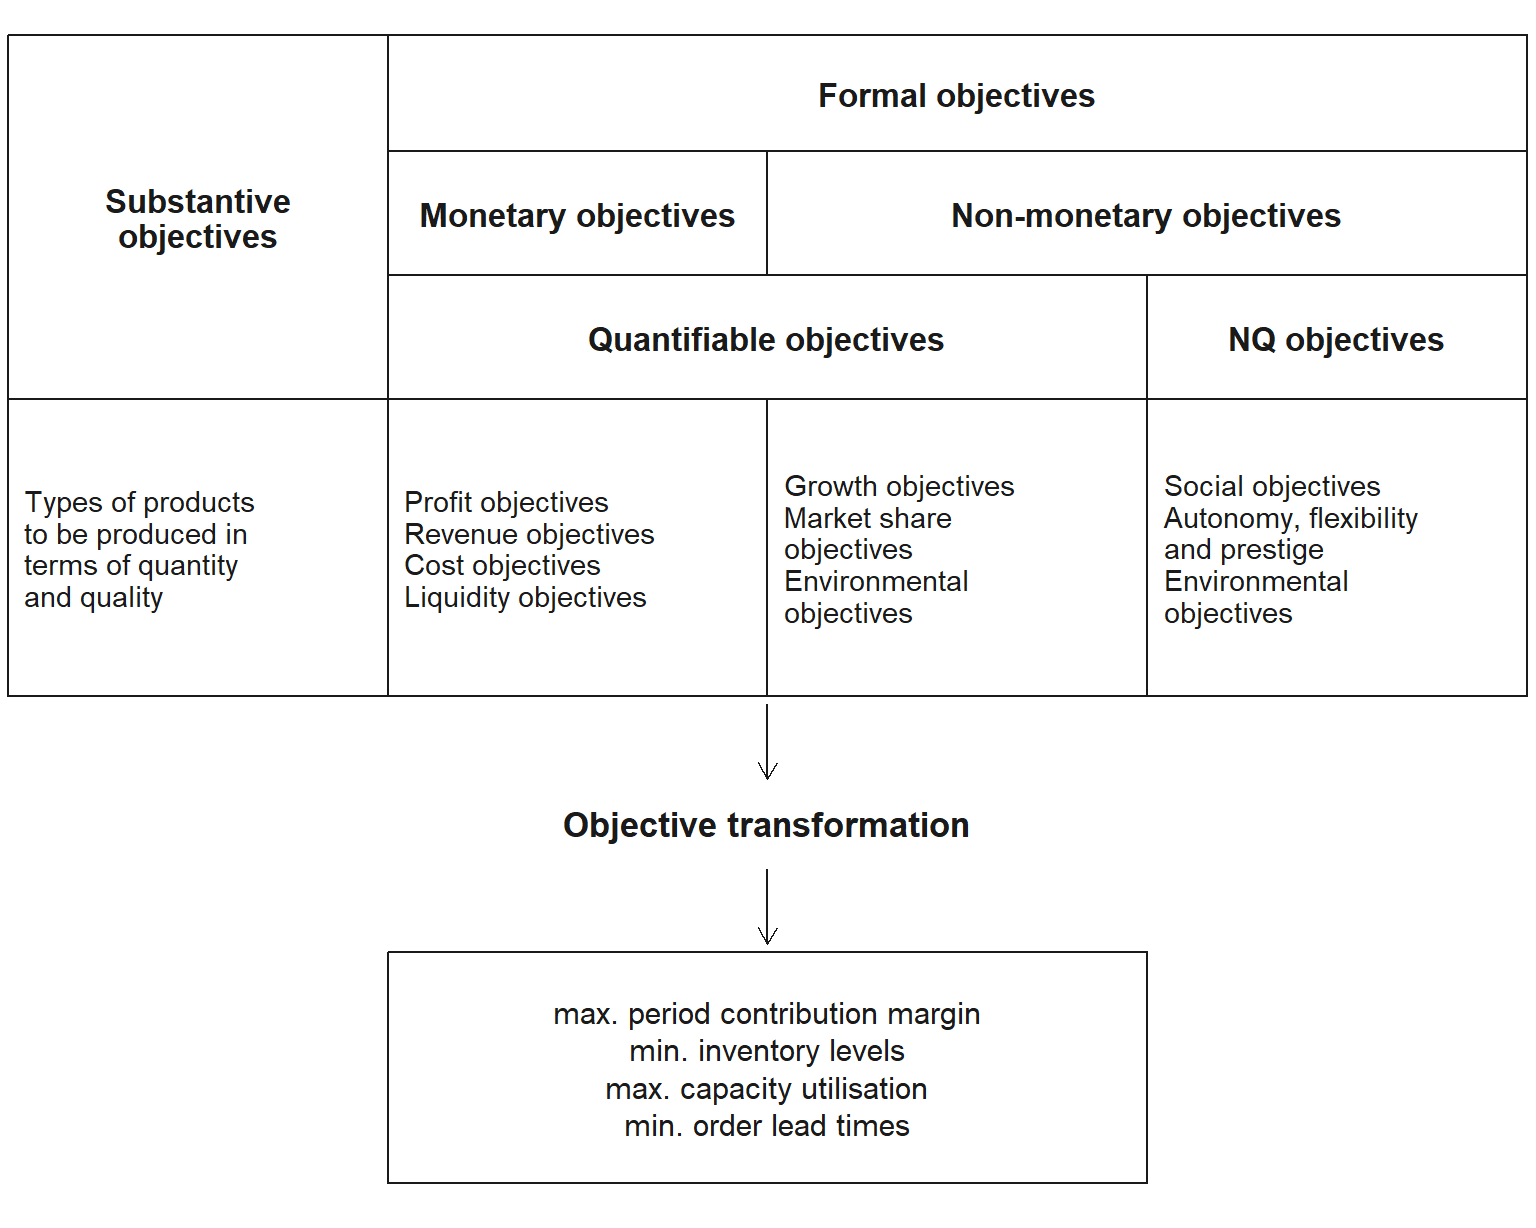
Objectives in logistics and SCM
Traditional target metrics
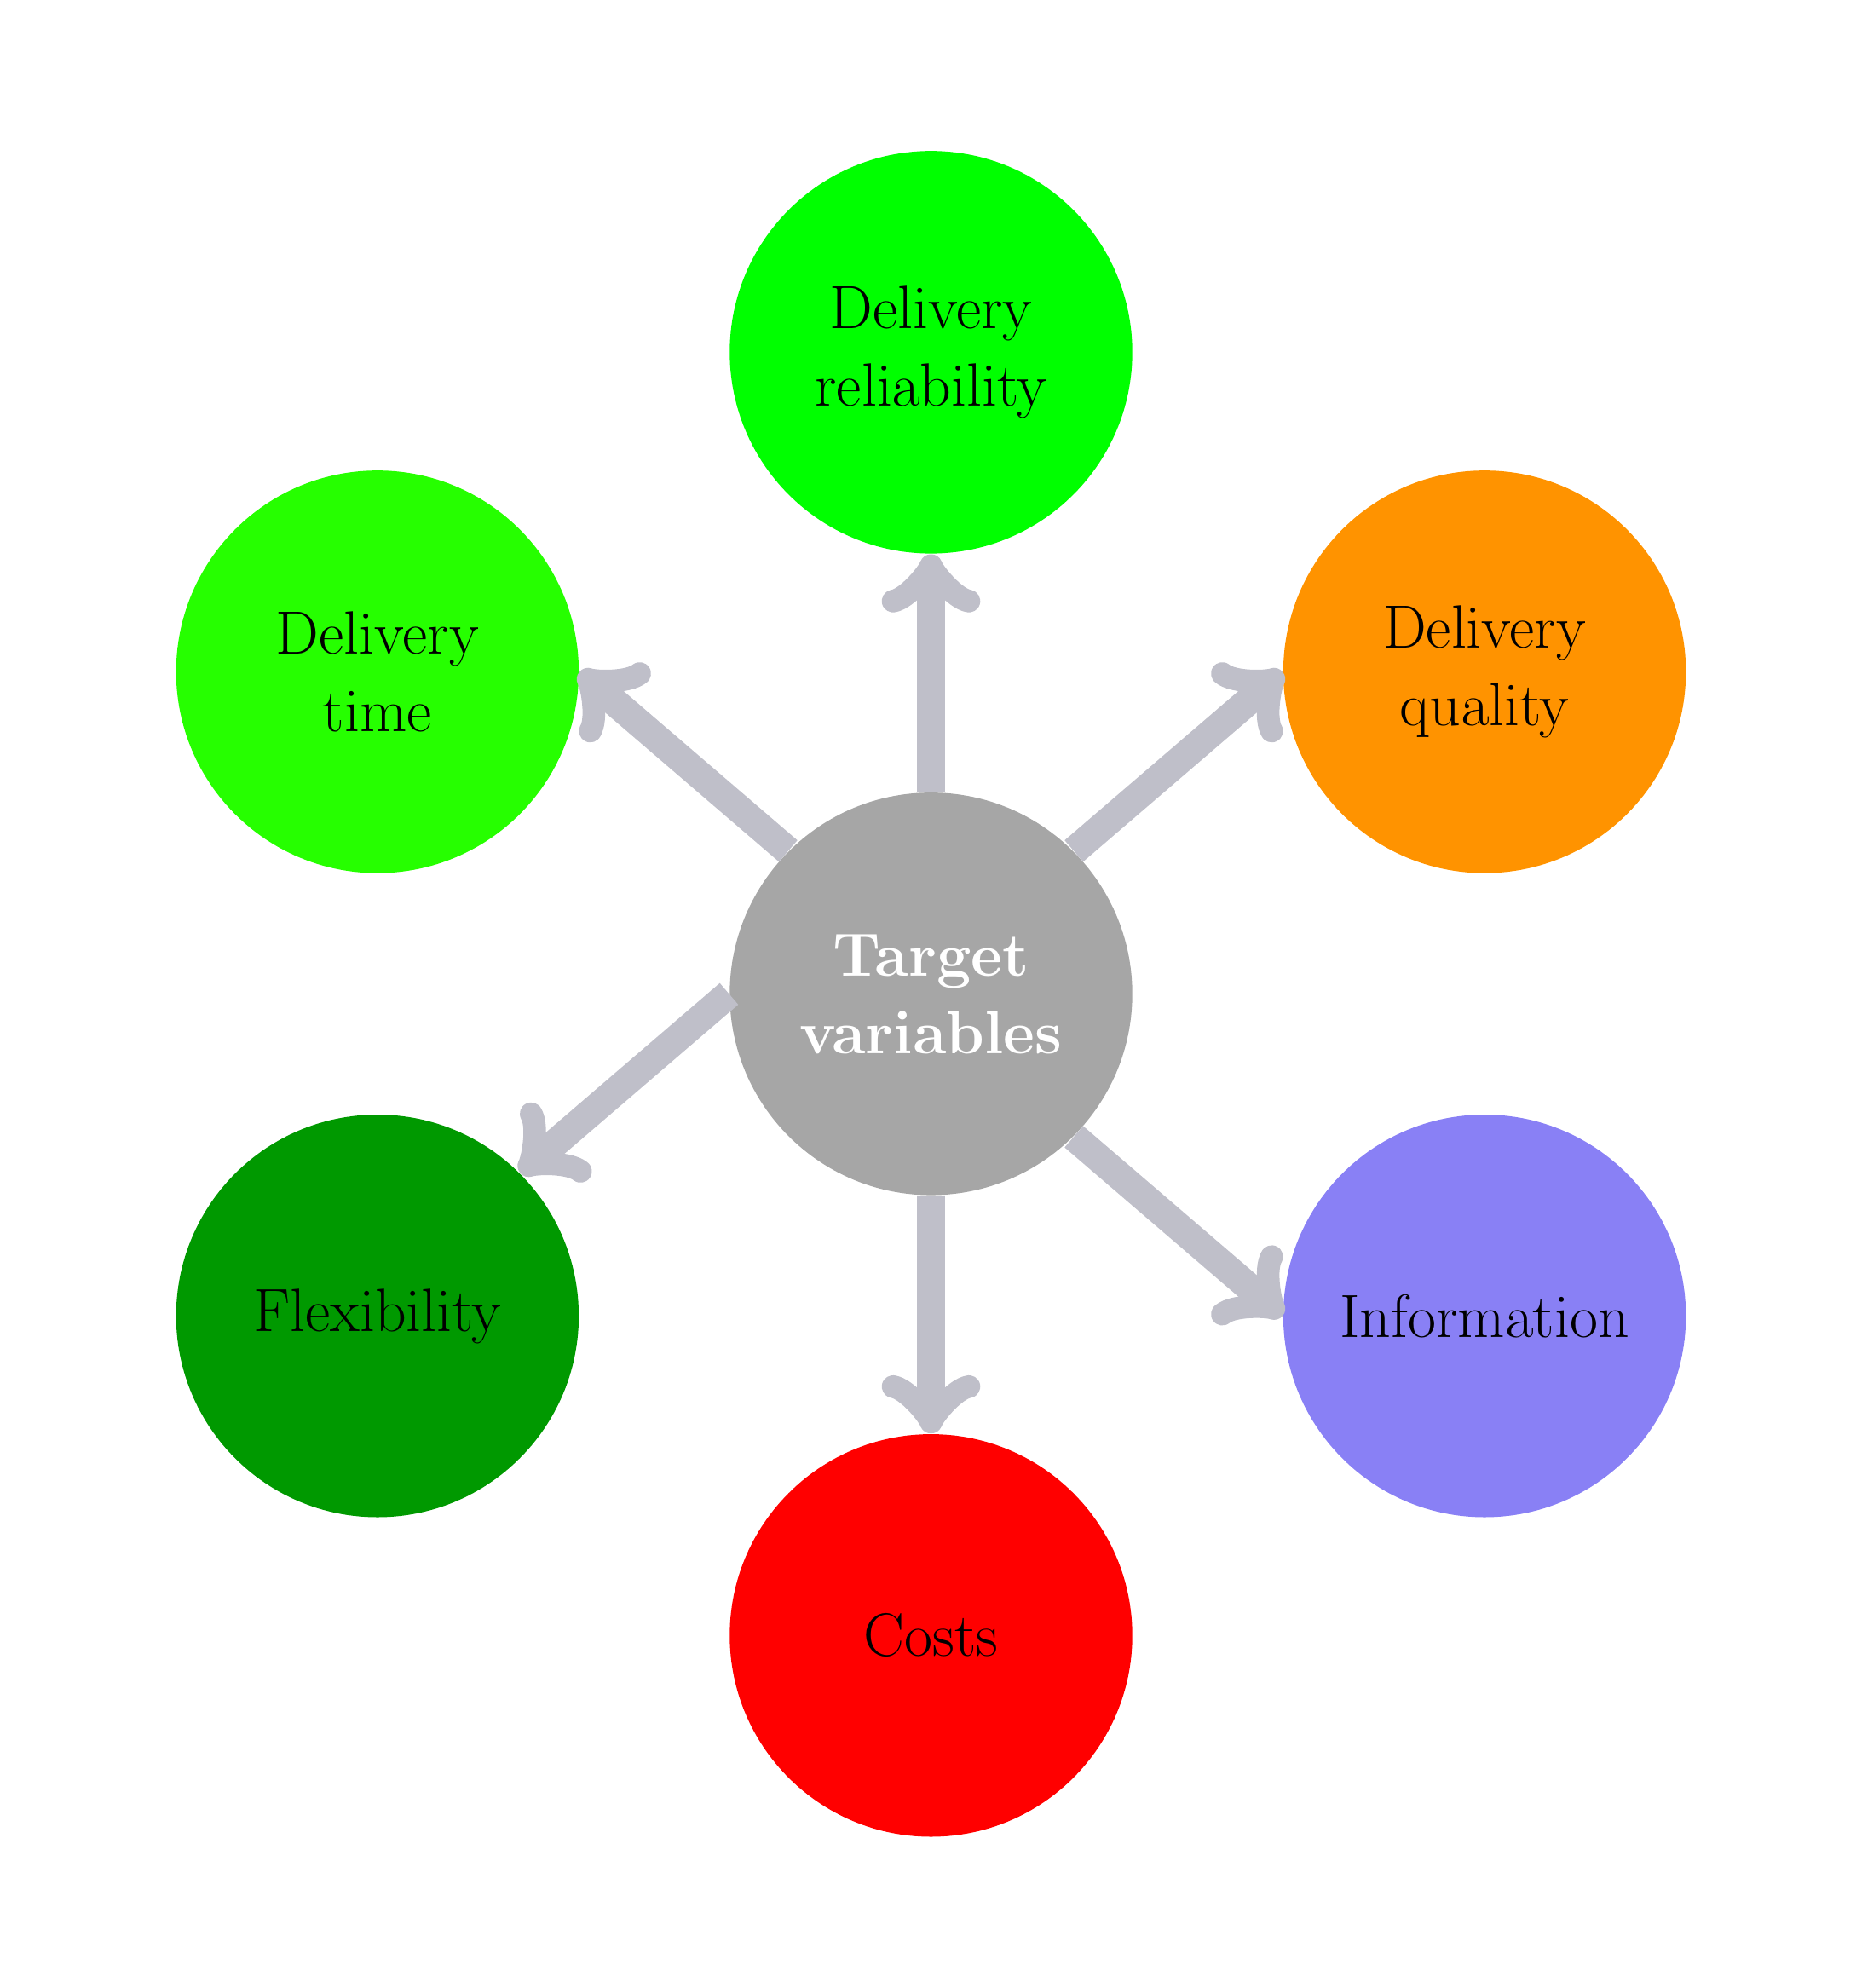
- Delivery time: time span between order placement and order fulfilment
- Delivery reliability: relationship between promised and actual delivery date
- Delivery quality: share of orders executed correctly in terms of quality and quantity
- Flexibility/resilience: feasibility of short-term changes in quantity, dates and specifications
- Information: quality and transparency of information in all phases of order processing
- Costs: efficiency of all logistics activities, total costs of logistics activities
Target dimensions
Conflicts & profiles
Target dimensions
Target profiles
Logistics costs
Trade-off decisions in logistics and SCM
- Conflicting cost components in many areas of logistics \(\rightarrow\) a cost optimum exists (at least in theory)
- Logistics management means, among other things, making decisions about logistics systems
- Transparency of cost functions is sometimes severely limited
- Data availability
- Intertemporal attributability
- Cost object assignment
- Stochasticity
Logistics costs
Examples
Logistics costs
valued consumption of goods and services for the purpose of providing logistics services.
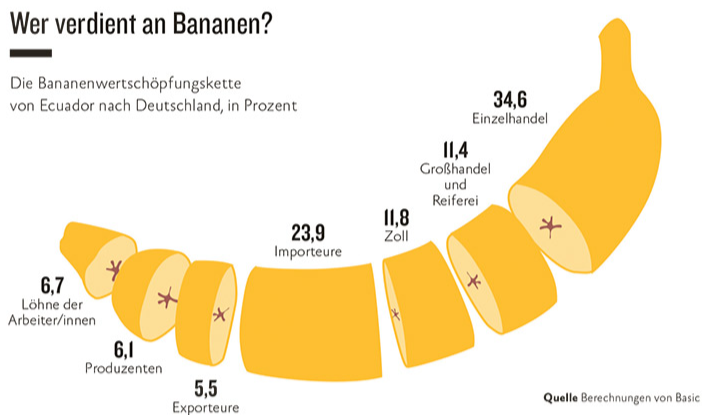
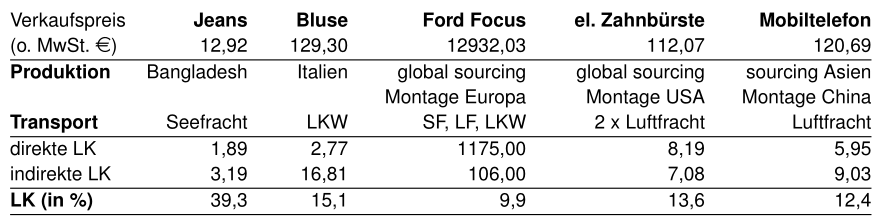
Supply Chain Costing
Example – Apple Video iPod 30 GB
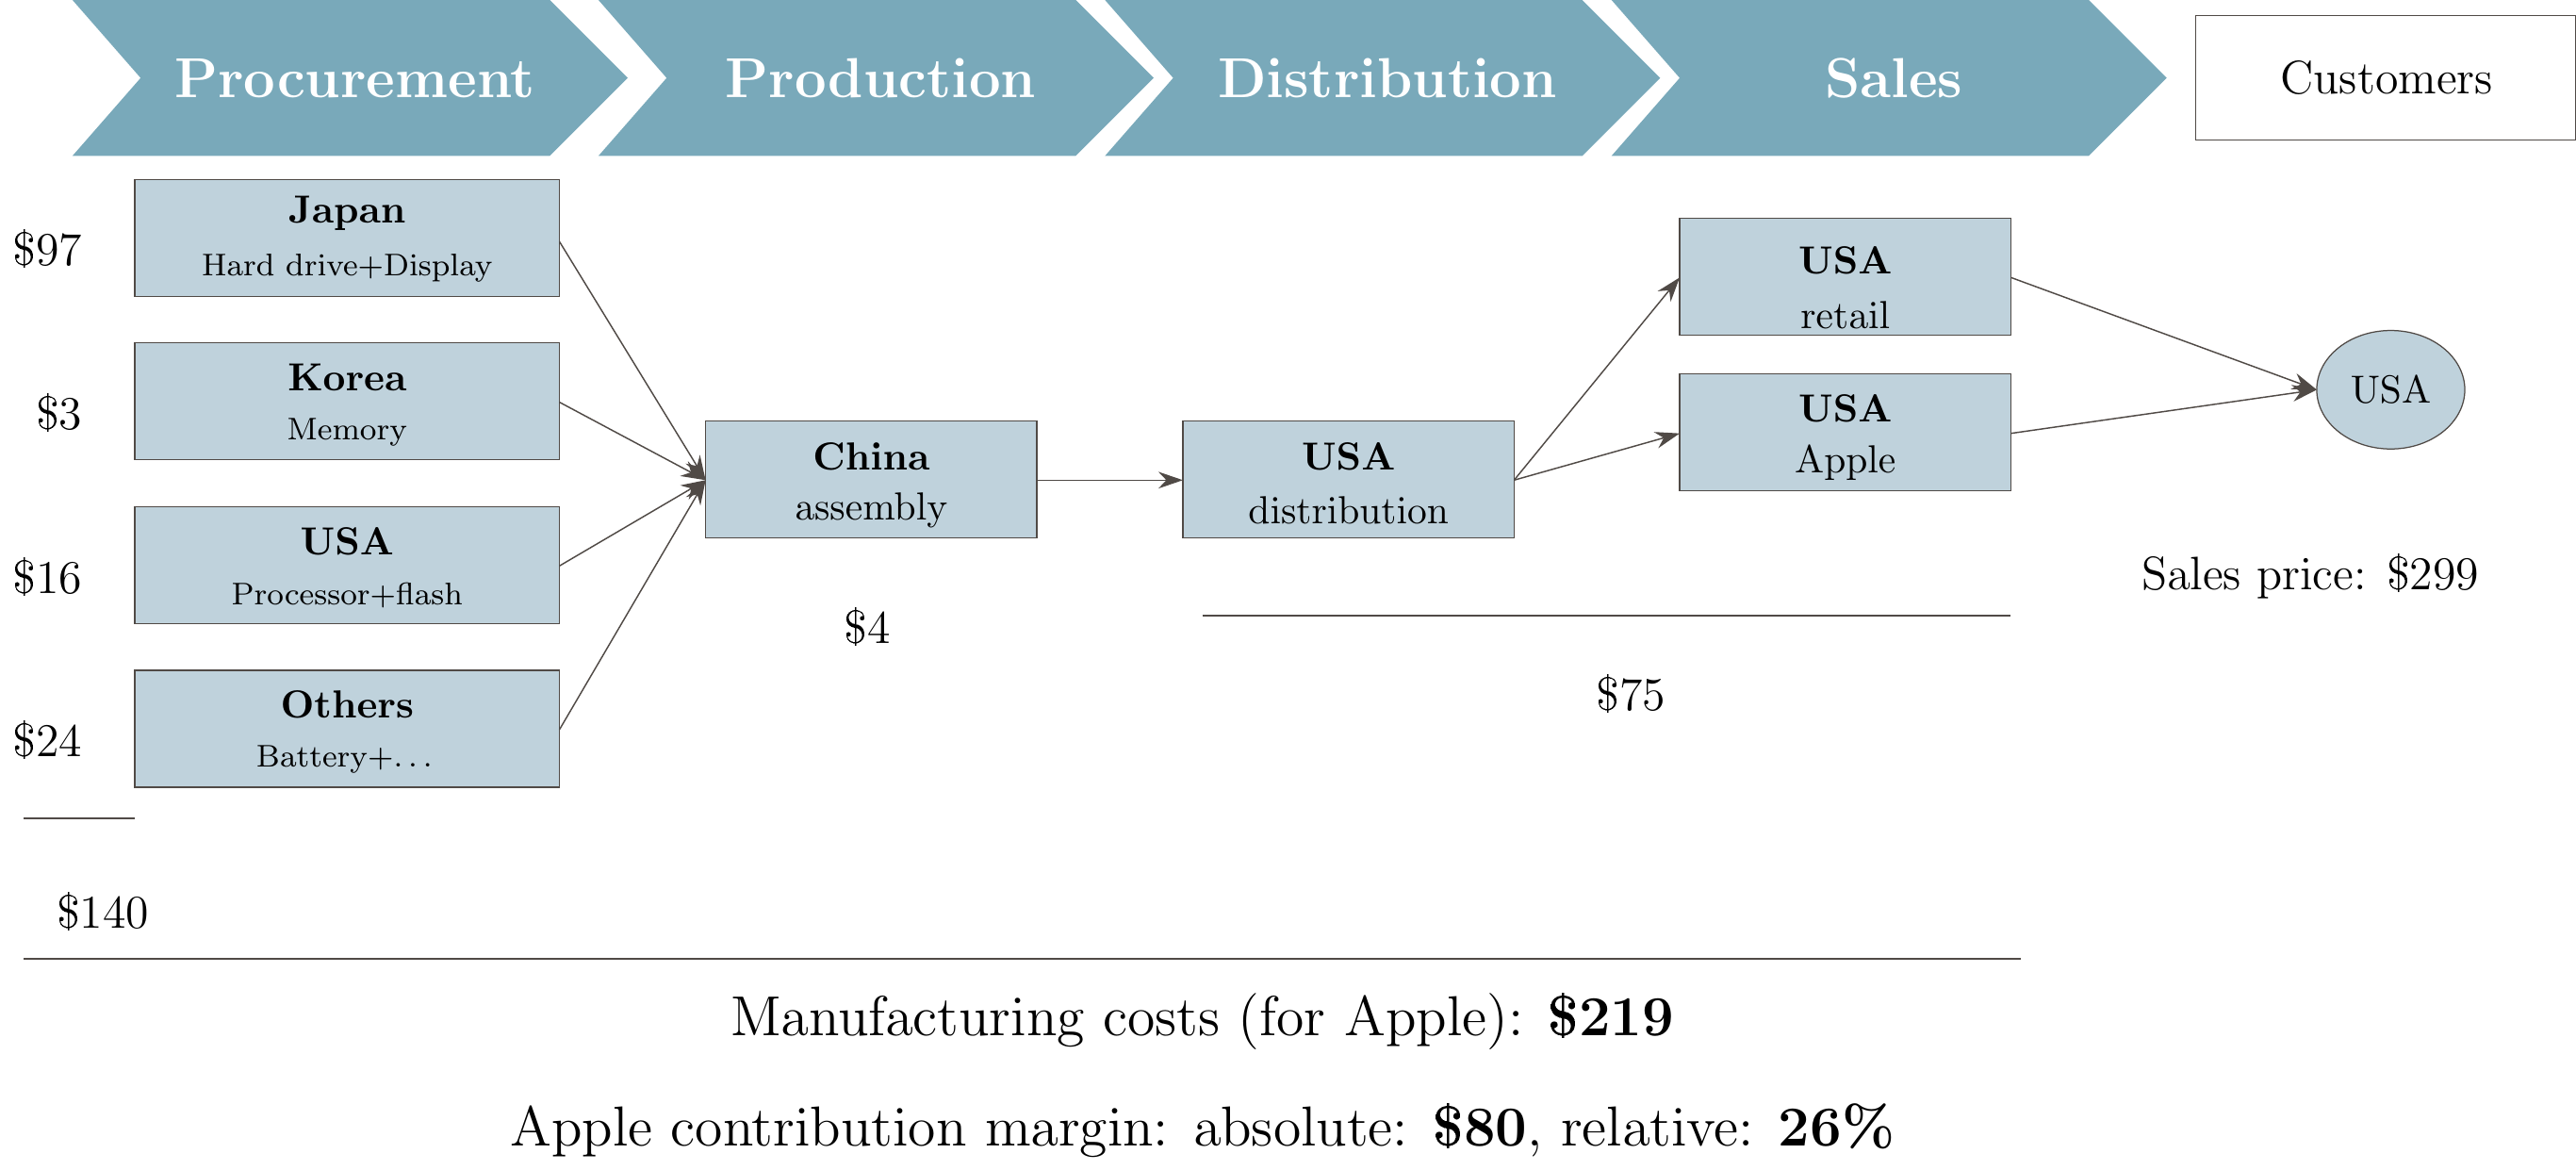
Sustainable Supply Chain management
Sustainability as a target dimension
Definition of sustainability (an attempt)
A social system is described as sustainable if it can be regarded as fair both intra- and intergenerationally. Fair means that it “meets the needs of the present without compromising the ability of future generations to meet their own needs” (Hauff 1987)
Sustainability & sustainable development
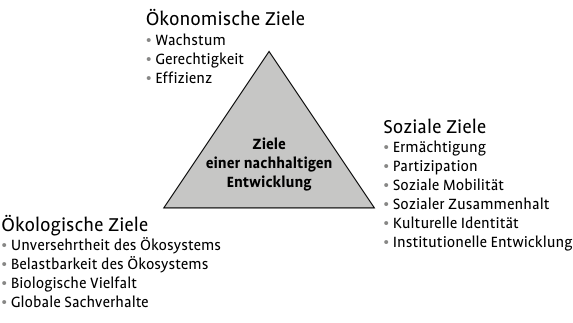
Possible target dimensions
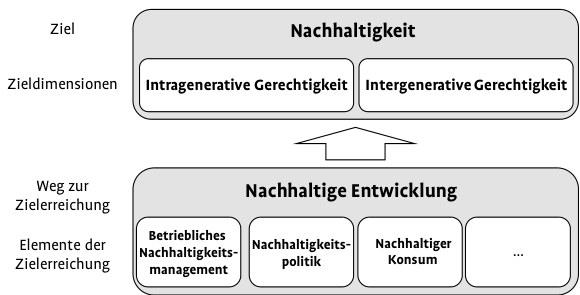
Ecological strategic fit
Ecological orientation and exposure (Günther 2008)
Ecological resistance
High exposure but low ecological orientation. Delaying or minimalist response patterns are typical.
-
SKW Piesteritz (chemicals)
only minimum regulatory adjustment; ecological investments are postponed, lobbying
Dimensions of ecological SCM strategies
Sustainability
General concepts (Ellen MacArthur Foundation)
Sustainability pyramid
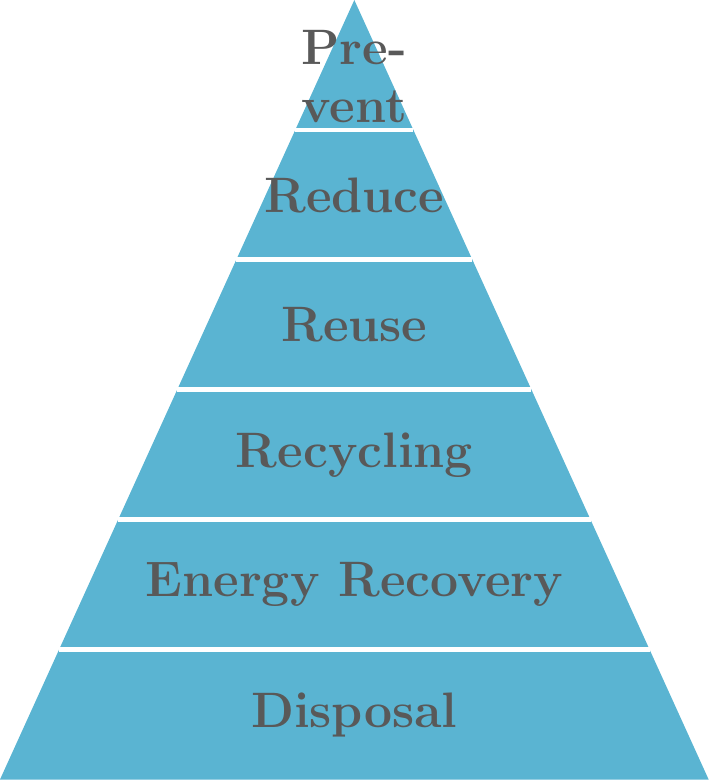
Circular economy 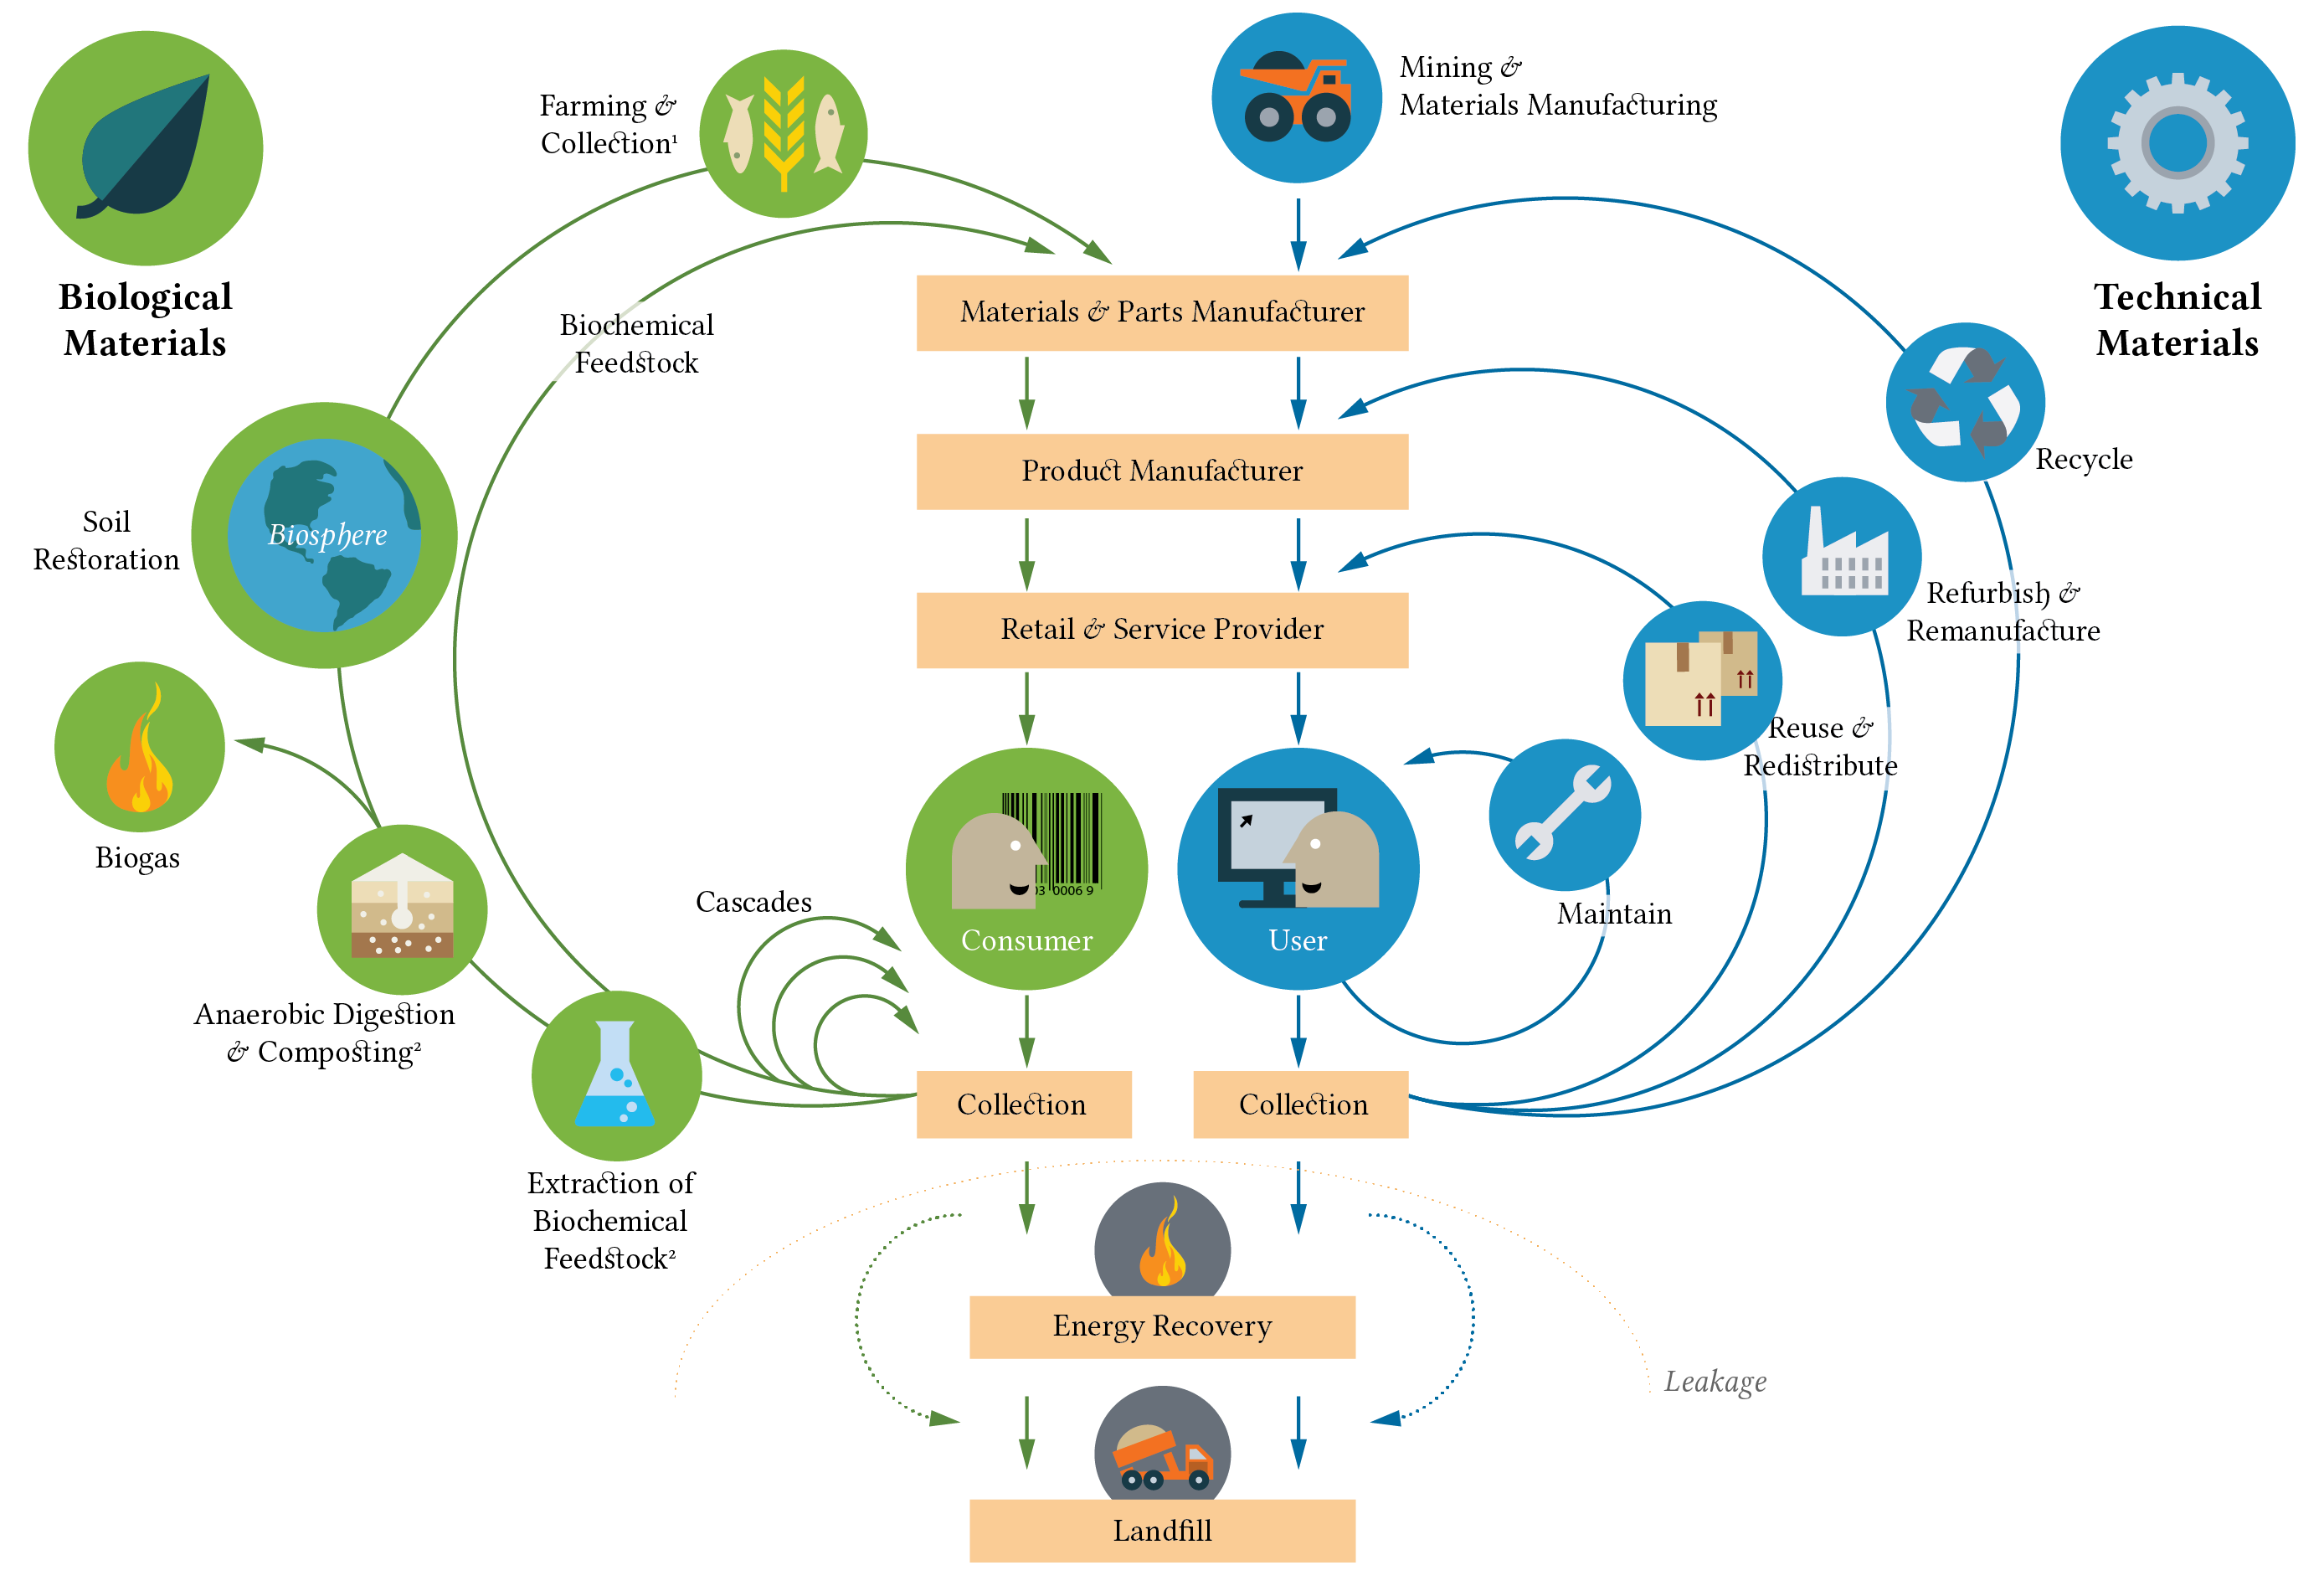
Circular Supply Chain
Relationship between linear, reverse and circular supply chains
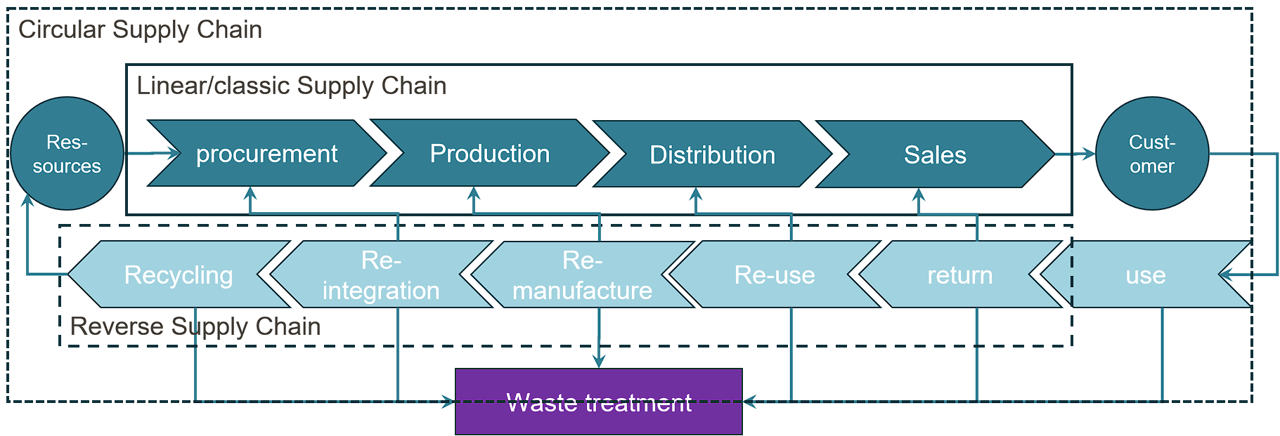
Sustainable SCM
refers to the planning, execution and control of business processes taking into account economic, ecological and social objectives in order to ensure the long-term competitiveness of the supply chain.
Sustainable Supply Chain Management
Circularity & sustainability concepts
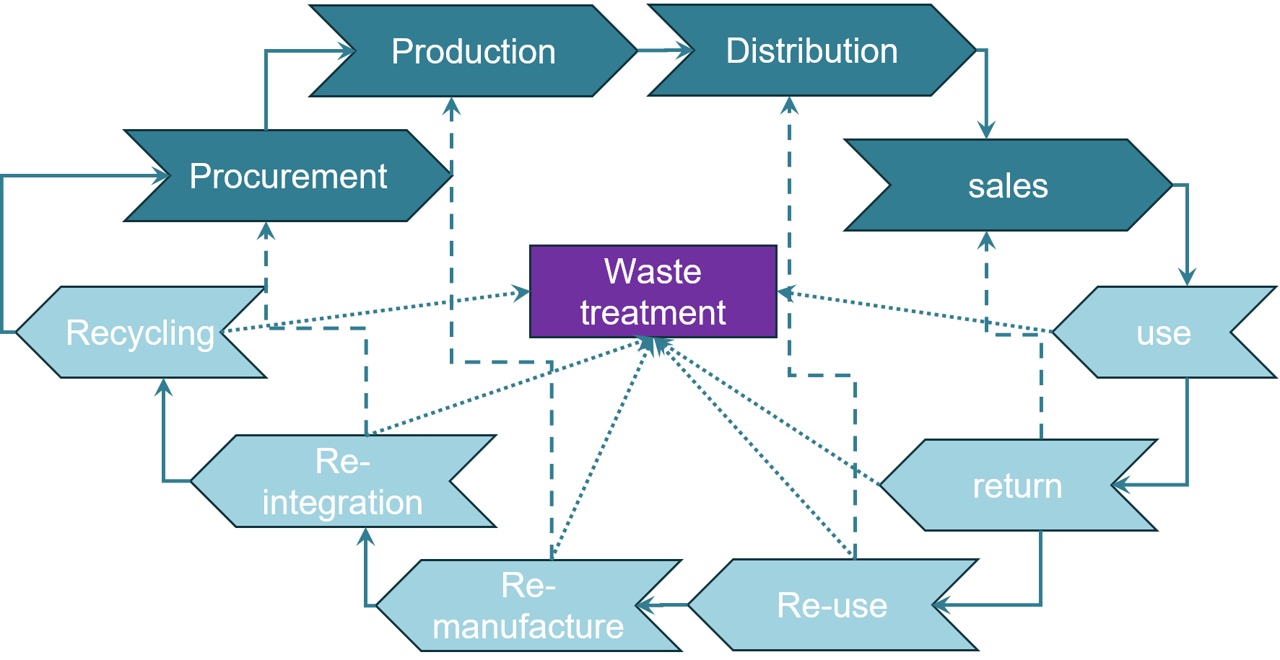
- Circular Product Design
- Recyclability
- Reuse
- Recycled content
- Sustainable logistics
- Weight reduction
- Distance reduction
- Transport avoidance
- Circular production
- Renewable energy
- Use of production waste
- Recirculation of operating supplies and auxiliary materials
Sustainable SCM
Planning tasks
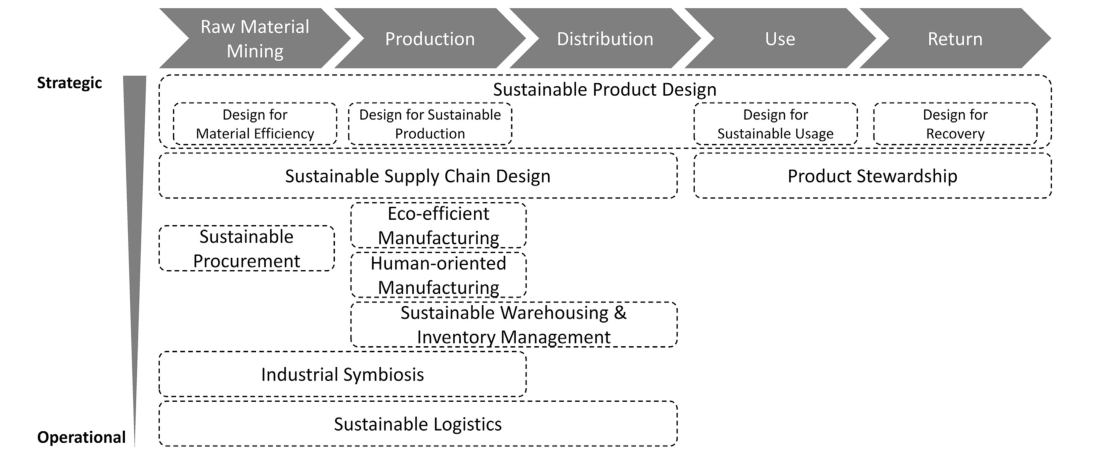
Circular Supply Chain Management
Generic strategies
Circular Supply Chain Management
Generic strategies
Circular Supply Chain Management
Generic strategies
Circular Supply Chain Management
Generic strategies
Case example SushiFresh GmbH
The business idea
SushiFresh GmbH is a start-up offering sushi boxes freshly made every day in a German metropolitan region.
- Promise: “Made today, sold today” – restaurant-quality sushi, but without the wait
- Production: one central kitchen, production in the early morning hours
- Sales channel: supermarkets (shelf sales)
- Range: approx. 12 boxes (classic, vegetarian, vegan)
Key facts
- Shelf life: max. 24–36 hours
- Cold chain: continuously 0–4 °C
- Ingredients: rice, nori, vegetables (regional), salmon and tuna (imported)
- Demand: highly volatile (weekday, weather, events)
- Market launch: growth from 3 to 30 points of sale planned
Case example SushiFresh GmbH
Discussion
Guiding questions: strategic position
- Which customer groups and needs drive the positioning – price, freshness, convenience or sustainability?
- How does SushiFresh differ from competitors (restaurants, delivery services, supermarket sushi)?
- Which trade-offs arise (freshness vs. costs vs. waste vs. environment)?
- Where does the company sit between efficiency and responsiveness? Which target variables are strategically important?
Guiding questions: supply chain structure
- How does the supply chain deal with volatile demand and highly perishable goods?
- How can the cold chain and freshness be ensured along the entire chain?
- Which stages and partners belong to the supply chain (suppliers, kitchen, logistics, retail)?
- How should the supply chain be structured: centralisation vs. decentralisation?
- What depth of value creation could SushiFresh aim for? (e.g. in-house logistics?)
Objective: Prepare a strategic analysis of SushiFresh’s business model. Derive a suitable supply chain structure.
Strategic Design of Supply Chains
Strategic Design of Supply Chains
- Multi-criteria facility location planning
- Continuous facility location planning
- Discrete facility location planning
Learning objectives
After this unit you will be able to …
- classify location decisions within strategic supply chain design,
- systematically capture and evaluate qualitative location factors,
- explain and apply the AHP method and the scoring model,
- explain the properties of different distance metrics and calculate them,
- apply and interpret continuous location methods for simple decision problems.
Further reading
- Model-based regional facility location planning and development: (Kik 2022).
- Facility location planning and continuous decision models: (Thonemann 2023, chap. 3).
- Continuous location models and local equilibria: (Cooper 1968).
Planning in Supply Chain Management
Supply Chain Planning Matrix
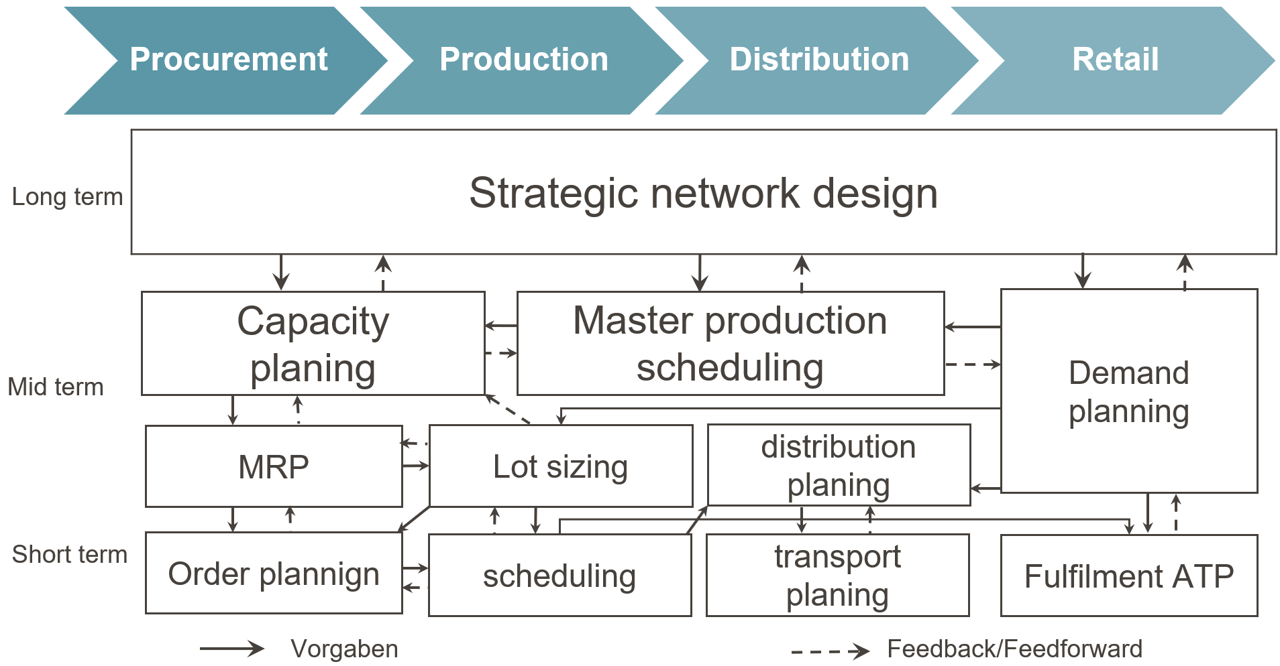
Strategic Network Planning
Objective of facility location planning
Decision on the location of:
- distribution warehouses
- factories
- sales outlets
- supply warehouses
- …
Strategic Network Planning
Phases of location selection
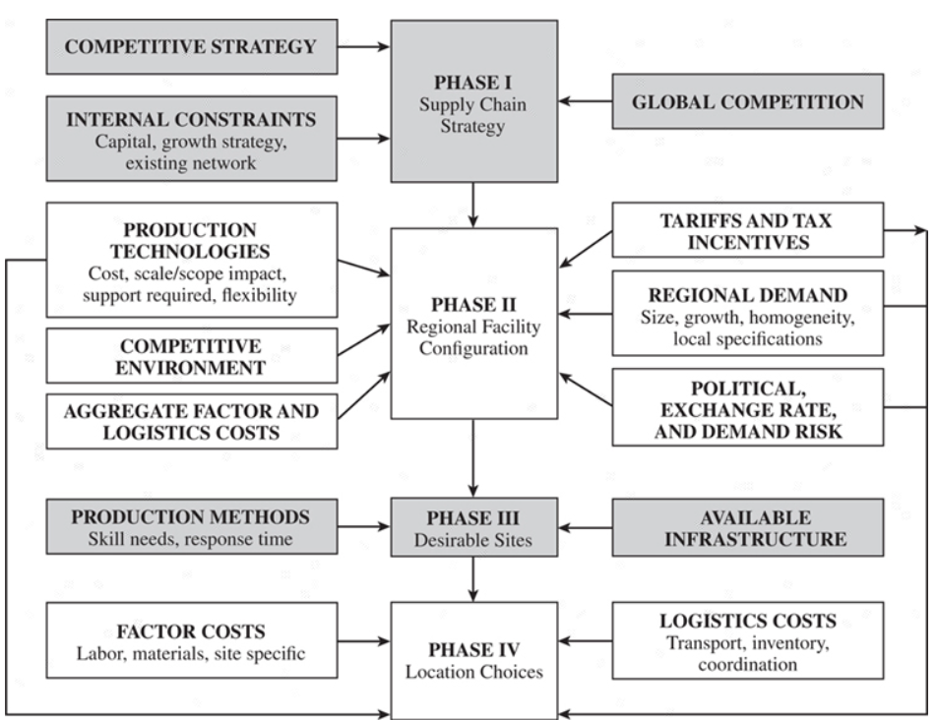
Strategic Network Planning
Facility location planning process
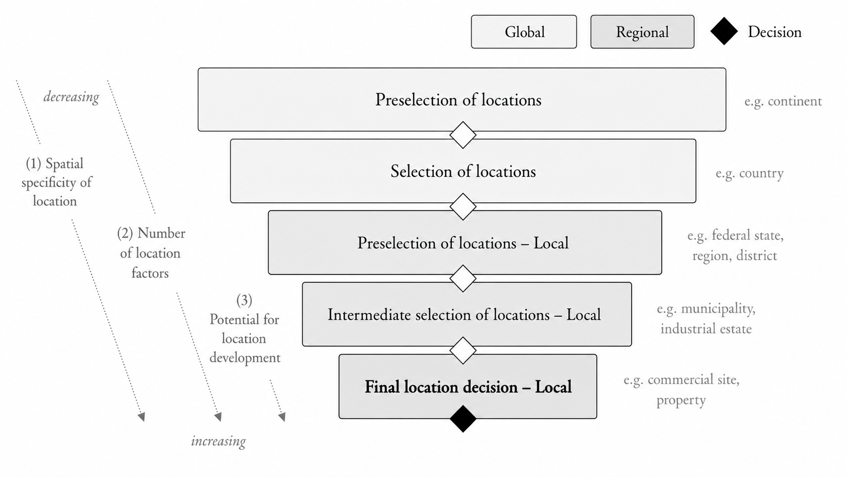
(Kik 2022)
- At global level, options are usually limited (continent/country) \(\rightarrow\) factors heavily simplified and aggregated \(\rightarrow\) non-specific; goal is strategic fit
- At regional level, goal is to identify the optimal location \(\rightarrow\) more precise requirements
Strategic Network Planning
Location factors
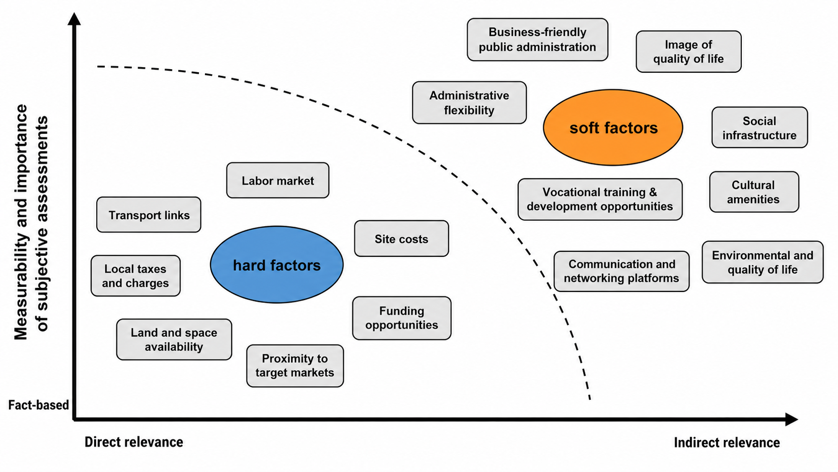
- Evaluating sites for new facilities is often difficult
- irreversible in the short term \(\rightarrow\) path dependencies
- Multidimensional \(\rightarrow\) effects on the system of objectives hard to oversee
- Subjective \(\rightarrow\) assessments of soft factors often vary & their importance is weighted differently
Strategic Network Planning
Methods of facility location planning
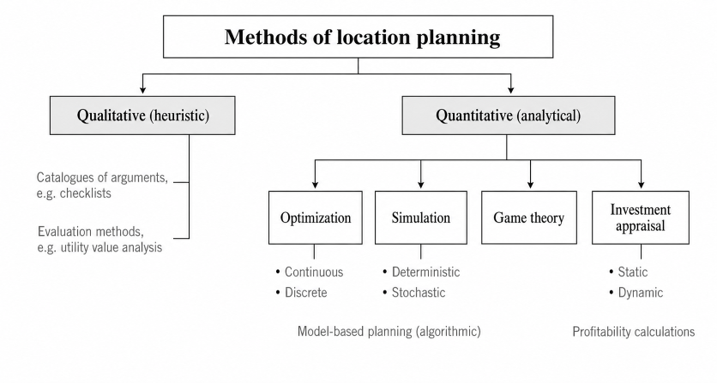
(Kik 2022)
- Qualitative methods \(\rightarrow\) heuristic, mostly survey-based methods \(\rightarrow\) snapshot of opinion and collection of individual assessments
- Quantitative methods
- Optimisation: decision space (options) and one-dimensional system of objectives required
- Simulation: complex, hard to transfer, multidimensional
- Game theory: anticipation of competitor behaviour \(\rightarrow\) sales maximisation
- Investment appraisal: exclusively monetary quantities (optimisation)
Strategic Network Planning
Case study: SushiFresh GmbH
SushiFresh GmbH is a fictitious regional producer of fresh sushi boxes in the Rhine-Main region that supplies six supermarket stores every day. This case study accompanies us through this and the following chapters.
SushiFresh is examining whether, in addition to delivery, an own production facility is worthwhile, and has identified three candidate sites.
# Six stores: coordinates, daily demand mu and standard deviation sigma
filialen <- tibble(
  Filiale = c("Wiesbaden", "Mainz", "Frankfurt", "Ruesselsheim", "Darmstadt", "Offenbach"),
  lat   = c(50.0782, 50.0000, 50.1109, 49.9904, 49.8728, 50.0956),
  lon   = c(8.2398,  8.2711,  8.6821,  8.4116,  8.6512,  8.7761),
  mu    = c(120, 150, 280, 90, 110, 95),
  sigma = c(25, 30, 55, 20, 24, 22)
)

# Three candidate locations for the production facility
standorte <- tibble(
  Standort = c("Wiesbaden-Erbenheim", "Mainz-Hechtsheim", "Raunheim"),
  lat = c(50.0632, 49.9698, 50.0000),
  lon = c(8.2999,  8.2831,  8.4650),
  Fixkosten = c(180000, 210000, 260000)
)

sum(filialen$mu)  # Total demand: 845 boxes/day
[1] 845Qualitative Facility Location Planning
Scoring model (utility analysis)
Procedure
- Define relevant evaluation criteria
- Determine criteria weights
- Rate alternatives per criterion
- Aggregate weighted partial scores into a total score
- Rank alternatives by total score
Critical points
- Additive model only interpretable to a limited extent
- Poor ratings can be compensated by good ones
- Utility independence of criteria often questionable
- Results are sensitive to the weighting
- Risk of goal fragmentation
Case example
SushiFresh evaluates the three candidate locations Wiesbaden-Erbenheim, Mainz-Hechtsheim and Raunheim for the new production facility using the criteria transport proximity, rental costs and availability of skilled labour, which for simplicity are weighted equally here.
The set-up is deliberately chosen to produce very different location profiles: Wiesbaden-Erbenheim is strong on rental costs, Raunheim on transport proximity, while Mainz-Hechtsheim leads on skilled labour.
This very example shows the weakness of the additive scoring model: despite clearly different profiles of strengths and weaknesses, all alternatives can achieve the same total score.
Qualitative Facility Location Planning
Scoring model in R: code and results table
library(dplyr)
library(knitr)

# Table with raw data of the case study (three criteria, equally weighted)
nwa <- tibble(
  Kriterium = c(
    "Transport proximity",
    "Rental costs",
    "Skilled labour availability"
  ),
  Gewicht = c(1/3, 1/3, 1/3),
  `WI-Erb`  = c(5, 8, 2),
  `MZ-Hech` = c(2, 5, 8),
  Raunheim  = c(8, 2, 5)
)

# Calculate the scores of the locations
nutzwert <- c(
    `WI-Erb`  = sum(nwa$Gewicht * nwa$`WI-Erb`),
    `MZ-Hech` = sum(nwa$Gewicht * nwa$`MZ-Hech`),
    Raunheim  = sum(nwa$Gewicht * nwa$Raunheim)
  )

# Combine raw data and scores in one table
nwa <- bind_rows(nwa, nutzwert)

# Set name "Score" in row 4, column Kriterium
nwa$Kriterium[4] <- "Score"

# Output table
nwa |>
  mutate(
    Gewicht = ifelse(is.na(Gewicht), "", sprintf("%.2f", Gewicht)), # Show 2 decimal places
    `WI-Erb` = sprintf("%.1f", `WI-Erb`),
    `MZ-Hech` = sprintf("%.1f", `MZ-Hech`),
    Raunheim = sprintf("%.1f", Raunheim)
  ) |>
  kable(
    col.names = c("Criterion", "Weight", "WI-Erb", "MZ-Hech", "Raunheim"),
    format = "html",
    align = c("l", "c", "c", "c", "c")
)| Criterion | Weight | WI-Erb | MZ-Hech | Raunheim |
|---|---|---|---|---|
| Transport proximity | 0.33 | 5.0 | 2.0 | 8.0 |
| Rental costs | 0.33 | 8.0 | 5.0 | 2.0 |
| Skilled labour availability | 0.33 | 2.0 | 8.0 | 5.0 |
| Score | 5.0 | 5.0 | 5.0 |
Qualitative Facility Location Planning
Analytic Hierarchy Process (AHP method)
Bottom level: Determine how the alternatives contribute to the criteria.
⇓
Medium level: Determine how the evaluation criteria contribute to achieving the objective.
⇓
Top level: Determine the best of the given alternatives (objective).
Bottom-up hierarchy (Klein and Scholl 2011, 361)
Procedure
- Carry out pairwise comparisons between all alternatives with respect to the evaluation criteria.
- Derive a ranking of alternatives for each evaluation criterion (synthesis).
- Carry out pairwise comparisons between all evaluation criteria.
- Derive a ranking of the evaluation criteria (synthesis).
- Calculate the score for the alternatives.
Qualitative Facility Location Planning
Analytic Hierarchy Process (AHP method) – example
Case example
SushiFresh now compares the three candidate locations Wiesbaden-Erbenheim (W-E), Mainz-Hechtsheim (M-H) and Raunheim (R) pairwise instead of using directly estimated scores. The following evaluation criteria are used.
- Transport proximity: distance to the six stores
- Rental costs: annual fixed costs of the site
- Skilled labour availability: access to catering/food specialists
Rating scale
| Preference | Value |
|---|---|
| Equal | 1 |
| Equal to slightly preferred | 2 |
| Slightly preferred | 3 |
| Slightly to clearly preferred | 4 |
| Clearly preferred | 5 |
| Clearly to strongly preferred | 6 |
| Strongly preferred | 7 |
| Strongly to extremely preferred | 8 |
| Extremely preferred | 9 |
Qualitative Facility Location Planning
Analytic Hierarchy Process (AHP method) – example
Procedure
- Carry out pairwise comparisons between all alternatives with respect to the evaluation criteria.
- Derive a ranking of alternatives for each evaluation criterion (synthesis).
- Carry out pairwise comparisons between all evaluation criteria.
- Derive a ranking of the evaluation criteria (synthesis).
- Calculate the score for the alternatives.
Transport proximity
| site | W-E | M-H | R |
|---|---|---|---|
| W-E | 1 | 2 | 1/2 |
| M-H | 1/2 | 1 | 1/3 |
| R | 2 | 3 | 1 |
Rental costs
| site | W-E | M-H | R |
|---|---|---|---|
| W-E | 1 | 2 | 4 |
| M-H | 1/2 | 1 | 2 |
| R | 1/4 | 1/2 | 1 |
Skilled labour
| site | W-E | M-H | R |
|---|---|---|---|
| W-E | 1 | 1/7 | 2 |
| M-H | 7 | 1 | 5 |
| R | 1/2 | 1/5 | 1 |
Qualitative Facility Location Planning
Analytic Hierarchy Process (AHP method) – example
Procedure
- Carry out pairwise comparisons between all alternatives with respect to the evaluation criteria.
- Derive a ranking of alternatives for each evaluation criterion (synthesis).
- Carry out pairwise comparisons between all evaluation criteria.
- Derive a ranking of the evaluation criteria (synthesis).
- Calculate the score for the alternatives.
Transport proximity — synthesis (calculation of the principal eigenvector)
Column sums
| site | W-E | M-H | R |
|---|---|---|---|
| W-E | 1 | 2 | 1/2 |
| M-H | 1/2 | 1 | 1/3 |
| R | 2 | 3 | 1 |
| \(\sum\) | 7/2 | 6 | 11/6 |
Normalisation
| site | W-E | M-H | R |
|---|---|---|---|
| W-E | 2/7 | 1/3 | 3/11 |
| M-H | 1/7 | 1/6 | 2/11 |
| R | 4/7 | 1/2 | 6/11 |
| \(\sum\) | 1 | 1 | 1 |
Consolidation
| site | W-E | M-H | R | \(\varnothing\) |
|---|---|---|---|---|
| W-E | 0.29 | 0.33 | 0.27 | 0.297 |
| M-H | 0.14 | 0.17 | 0.18 | 0.163 |
| R | 0.57 | 0.50 | 0.55 | 0.540 |
| \(\sum\) | 1 | 1 | 1 | 1 |
Qualitative Facility Location Planning
Analytic Hierarchy Process (AHP method) – example
Procedure
- Carry out pairwise comparisons between all alternatives with respect to the evaluation criteria.
- Derive a ranking of alternatives for each evaluation criterion (synthesis).
- Carry out pairwise comparisons between all evaluation criteria.
- Derive a ranking of the evaluation criteria (synthesis).
- Calculate the score for the alternatives.
Preference vectors of all locations for all criteria
| site | Transport proximity | Rental costs | Skilled labour |
|---|---|---|---|
| WI-Erb | 0.297 | 0.571 | 0.160 |
| MZ-Hech | 0.163 | 0.286 | 0.730 |
| Raunheim | 0.540 | 0.143 | 0.110 |
Qualitative Facility Location Planning
Analytic Hierarchy Process (AHP method) – example
Procedure
- Carry out pairwise comparisons between all alternatives with respect to the evaluation criteria.
- Derive a ranking of alternatives for each evaluation criterion (synthesis).
- Carry out pairwise comparisons between all evaluation criteria.
- Derive a ranking of the evaluation criteria (synthesis).
- Calculate the score for the alternatives.
| Criterion | Transport proximity | Rental costs | Skilled labour |
|---|---|---|---|
| Transport proximity | 1 | 3 | 2 |
| Rental costs | 1/3 | 1 | 1/5 |
| Skilled labour | 1/2 | 5 | 1 |
| \(\sum\) | 11/6 | 9 | 16/5 |
Qualitative Facility Location Planning
Analytic Hierarchy Process (AHP method) – example
Procedure
- Carry out pairwise comparisons between all alternatives with respect to the evaluation criteria.
- Derive a ranking of alternatives for each evaluation criterion (synthesis).
- Carry out pairwise comparisons between all evaluation criteria.
- Derive a ranking of the evaluation criteria (synthesis).
- Calculate the score for the alternatives.
Applying the same procedure (geometric mean of the rows, then normalise) as on the previous slide for the locations yields for the three criteria:
| Criterion | Transport proximity | Rental costs | Skilled labour | \(\varnothing\) |
|---|---|---|---|---|
| Transport proximity | 6/11 | 1/3 | 10/16 | 0.501 |
| Rental costs | 2/11 | 1/9 | 1/16 | 0.118 |
| Skilled labour | 3/11 | 5/9 | 5/16 | 0.380 |
| \(\sum\) | 1 | 1 | 1 | 1 |
Qualitative Facility Location Planning
Analytic Hierarchy Process (AHP method) – example
Procedure
- Carry out pairwise comparisons between all alternatives with respect to the evaluation criteria.
- Derive a ranking of alternatives for each evaluation criterion (synthesis).
- Carry out pairwise comparisons between all evaluation criteria.
- Derive a ranking of the evaluation criteria (synthesis).
- Calculate the score for the alternatives.
\(\left( \begin{array}{ccc} 0.297 & 0.571 & 0.160 \\ 0.163 & 0.286 & 0.730 \\ 0.540 & 0.143 & 0.110 \end{array} \right) \times \left( \begin{array}{c} 0.501\\ 0.118\\ 0.380 \end{array} \right) = \left( \begin{array}{c} 0.280\\ 0.390\\ 0.330 \end{array} \right) \begin{array}{c} \text{= Score WI-Erb}\\ \text{= Score MZ-Hech}\\ \text{= Score Raunheim} \end{array}\)
Result: The best alternative is Mainz-Hechtsheim — but only narrowly ahead of Raunheim!
Advantages of AHP
- Pairwise comparison increases transparency and simplifies ranking the alternatives.
- AHP offers less scope for decision-makers’ “bias” than the scoring model.
- Irrational judgements by decision-makers can be detected via a consistency index
Qualitative Facility Location Planning
Analytic Hierarchy Process (AHP method) – consistency index
- Product of non-normalised preference matrix and preference vector (criteria comparison): \[\left(\begin{array}{ccc} 1 & 3 & 2 \\ 1\!/\!3 & 1 & 1\!/\!5 \\ 1\!/\!2 & 5 & 1 \\ \end{array} \right)\times\left(\begin{array}{c} 0.510\\ 0.118\\ 0.380\\ \end{array}\right)=\left(\begin{array}{c} 1.624 \\ 0.364\\ 1.225\\ \end{array}\right)\]
- Divide the vector component-wise by the preference values: \[\begin{align*} 1.624 / 0.510 &= 3.184\\ 0.364 / 0.118 &= 3.085\\ 1.225 / 0.380 &= 3.224\\ \text{average }\bar{P} &= 3.164 \end{align*}\]
- Calculate the consistency index with \(n=3\) as \[ CI =\frac{\bar{P}- n}{n-1} = 0.08. \]
Interpretation
The closer \(CI\) is to 0, the more consistent the preference matrix. If \(CI=0\), it is perfectly consistent. \(\bar{P}\) is the largest eigenvalue of the preference matrix. With \(CR \approx 0.08\) the matrix is very close to 0 and can therefore be regarded as consistent.
Strategic Design of Supply Chains
- Multi-criteria facility location planning
- Continuous facility location planning
- Discrete facility location planning
Continuous Facility Location Planning
Neoclassical location theory – Steiner–Weber model
Assumptions
- A homogeneous plane (sales area) containing a finite number of customer locations.
- Demand quantities are given for each customer location and must be served in full.
- A transport cost function that depends on transport distance and transport quantity.
- Time is not considered

Objective
We seek the transport-cost-minimising location for a production, storage or transhipment facility in the sales area — for SushiFresh: the ideal point in the Rhine-Main region for the new production facility, regardless of the three sites actually available.
Continuous Facility Location Planning
Neoclassical location theory – Steiner–Weber model
Model formulation
Determine coordinates \((x,y)\) in the sales area that minimise the weighted total transport distance to the customer locations.
\[ \min\; Z(x,y) = \sum_{i=1}^{n} a_i \cdot d\big((x,y),(u_i,v_i)\big) \]
Decision variable
- \((x,y)\): coordinates of the location to be determined.
Parameters
- \((u_i,v_i)\): coordinates of customer location \(i\).
- \(a_i\): demand of customer location \(i\); for SushiFresh: boxes per day.
- \(d(\cdot)\): distance measure used.
Distance measures
- Euclidean distance: \(d = \sqrt{(x-u_i)^2 + (y-v_i)^2}\)
- Manhattan distance: \(d = |x-u_i| + |y-v_i|\)
- Road distances: shortest paths in a transport network.
Continuous Facility Location Planning
Steiner–Weber model with Euclidean distance
Iterative solution approach
For given customer locations \((u_i,v_i)\) and weights \(a_i\), with
\[ g_i(x,y)=\frac{a_i}{\sqrt{(x-u_i)^2+(y-v_i)^2}} \]
the update rule is
\[ x_{t+1}=\frac{\sum_{i=1}^n u_i\, g_i(x_t,y_t)}{\sum_{i=1}^n g_i(x_t,y_t)}, \qquad y_{t+1}=\frac{\sum_{i=1}^n v_i\, g_i(x_t,y_t)}{\sum_{i=1}^n g_i(x_t,y_t)}. \]
Weiszfeld algorithm (simplified)
- Choose a starting solution \((x_0,y_0)\), e.g. the weighted centre of gravity.
- Use the update rule to compute a new location.
- Repeat the step until the change is smaller than a tolerance.
Implementation in R
steiner_weber_euclid <- function(data, x0 = NULL, y0 = NULL,
                                 tol = 1e-6, max_iter = 1000) {
  # data must contain the columns u, v and a:
  # u = x-coordinate of the customers
  # v = y-coordinate of the customers
  # a = demand weight

  stopifnot(all(c("u", "v", "a") %in% names(data)))

  # Starting value: weighted centre of gravity, if none is given
  if (is.null(x0)) x0 <- sum(data$a * data$u) / sum(data$a)
  if (is.null(y0)) y0 <- sum(data$a * data$v) / sum(data$a)

  x <- x0
  y <- y0

  history <- data.frame(
    iter = 0,
    x = x,
    y = y,
    delta = NA_real_
  )

  for (t in 1:max_iter) {
    # Distance from the current location to each customer
    d <- sqrt((x - data$u)^2 + (y - data$v)^2)

    # Iteration weights according to the Weiszfeld algorithm
    g <- data$a / d

    # Update the coordinates
    x_new <- sum(data$u * g) / sum(g)
    y_new <- sum(data$v * g) / sum(g)

    # Change between two iterations
    delta <- sqrt((x_new - x)^2 + (y_new - y)^2)

    history <- rbind(
      history,
      data.frame(iter = t, x = x_new, y = y_new, delta = delta)
    )

    # Stop once the change is sufficiently small
    if (delta < tol) {
      return(list(
        x = x_new,
        y = y_new,
        iter = t,
        converged = TRUE,
        history = history
      ))
    }

    x <- x_new
    y <- y_new
  }

  list(
    x = x,
    y = y,
    iter = max_iter,
    converged = FALSE,
    history = history
  )
}
Notes
- Nearby customers with high demand receive a high weight in the iteration step \(\rightarrow\) location shifts in that direction
- Sensible starting value: weighted centre of gravity.
- Stop: small change in position or maximum number of iterations.
Continuous Facility Location Planning
Steiner–Weber model with Euclidean distance – example
Animation of the iteration path
Input data
| Store | Location (u_i,v_i) | Demand a_i |
|---|---|---|
| Wiesbaden | (8.2398; 50.0782) | 120 |
| Mainz | (8.2711; 50.0000) | 150 |
| Frankfurt | (8.6821; 50.1109) | 280 |
| Ruesselsheim | (8.4116; 49.9904) | 90 |
| Darmstadt | (8.6512; 49.8728) | 110 |
| Offenbach | (8.7761; 50.0956) | 95 |
Iterations
| Iteration t | Location (x,y) | Deviation |
|---|---|---|
| 0 | (8.7500; 49.8500) | --- |
| 1 | (8.5959; 50.0087) | 0.2212 |
| 2 | (8.5851; 50.0443) | 0.0372 |
| 3 | (8.5868; 50.0536) | 0.0095 |
| 4 | (8.5904; 50.0565) | 0.0046 |
| 5 | (8.5937; 50.0581) | 0.0037 |
Continuous Facility Location Planning
Euclidean Steiner–Weber model — shortcut
Centre of gravity
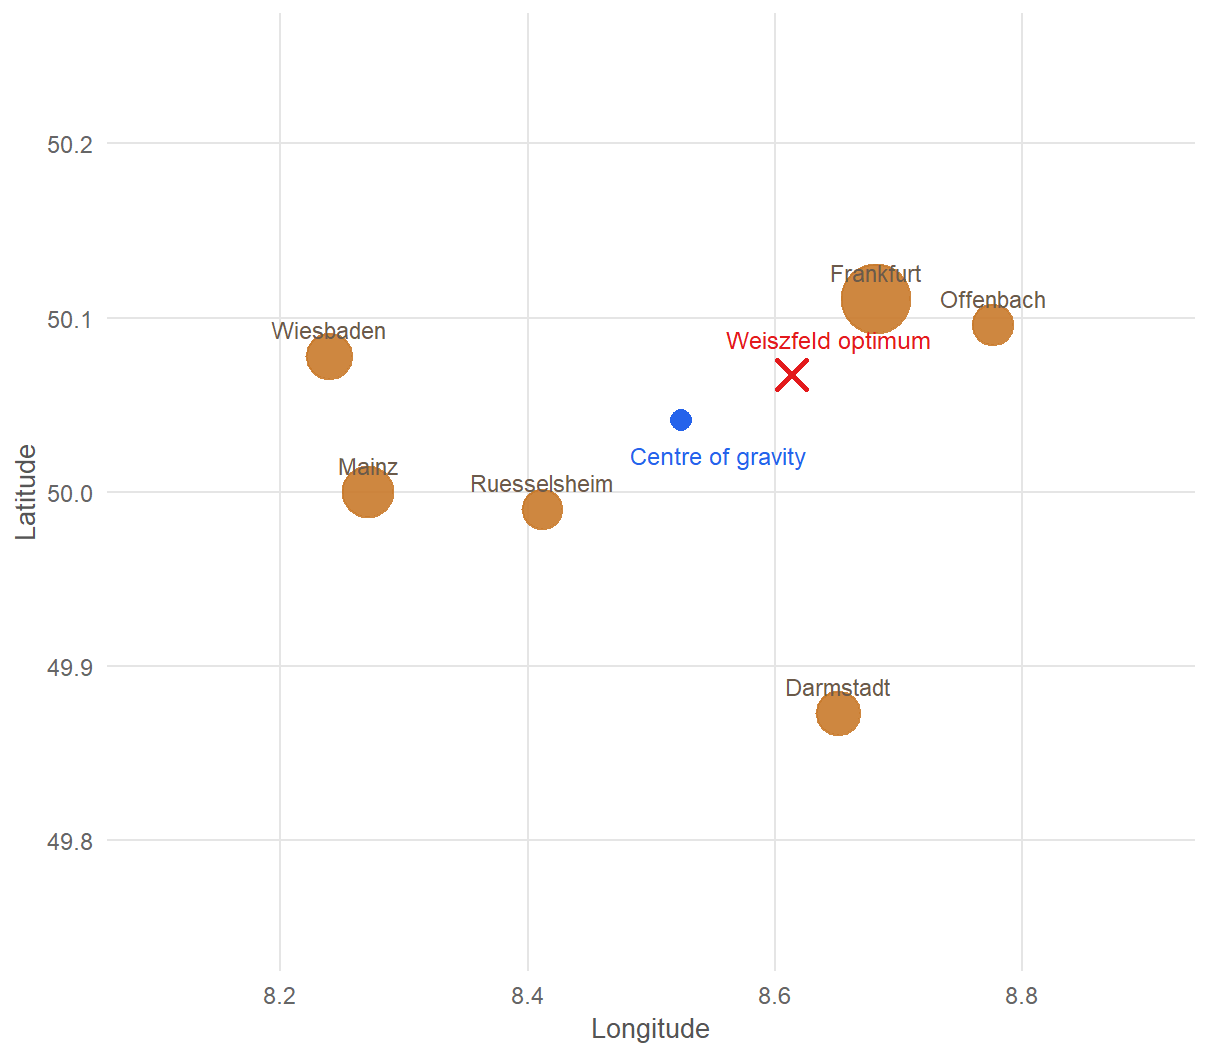
The centre of gravity is a centroid approximation of the Euclidean Steiner–Weber problem (here: longitude/latitude treated approximately as planar coordinates):
\[ x^{CoG} = \frac{\sum_{i=1}^{n} a_i u_i}{\sum_{i=1}^{n} a_i}, \qquad y^{CoG} = \frac{\sum_{i=1}^{n} a_i v_i}{\sum_{i=1}^{n} a_i}. \] For the SushiFresh example:
\[ (x^{CoG}, y^{CoG}) = (8.5241; 50.0410). \]
The centre of gravity is quick to compute, but only an approximation: in the example, the iterative Steiner–Weber location has a lower demand-weighted total haversine distance (1.4016^{4} vs. 1.409^{4} box-km).
Continuous Facility Location Planning
Steiner–Weber model with Manhattan distances
Steiner–Weber model with Manhattan distances
Determine coordinates \((x,y)\) in the sales area that minimise the weighted total transport distance to the customer locations.
\[ \min \; Z(x,y) = \sum_{i=1}^{n} a_i \left( |x-u_i| + |y-v_i| \right) = \sum_{i=1}^{n} a_i |x-u_i| + \sum_{i=1}^{n} a_i |y-v_i| \]
Algorithm for the optimal location
Determine the weighted median for each dimension — shown here for the \(x\)-coordinate (longitude):
- Sort the stores by ascending \(u_i\)-coordinates.
- Determine the cumulative demand \(A_j = \sum_{i=1}^{j} a_i\).
- Choose the first customer with \(A_j \geq \frac{1}{2}\sum_{i=1}^{n} a_i\).
- Its \(u_i\)-coordinate is the optimal \(x\)-coordinate.
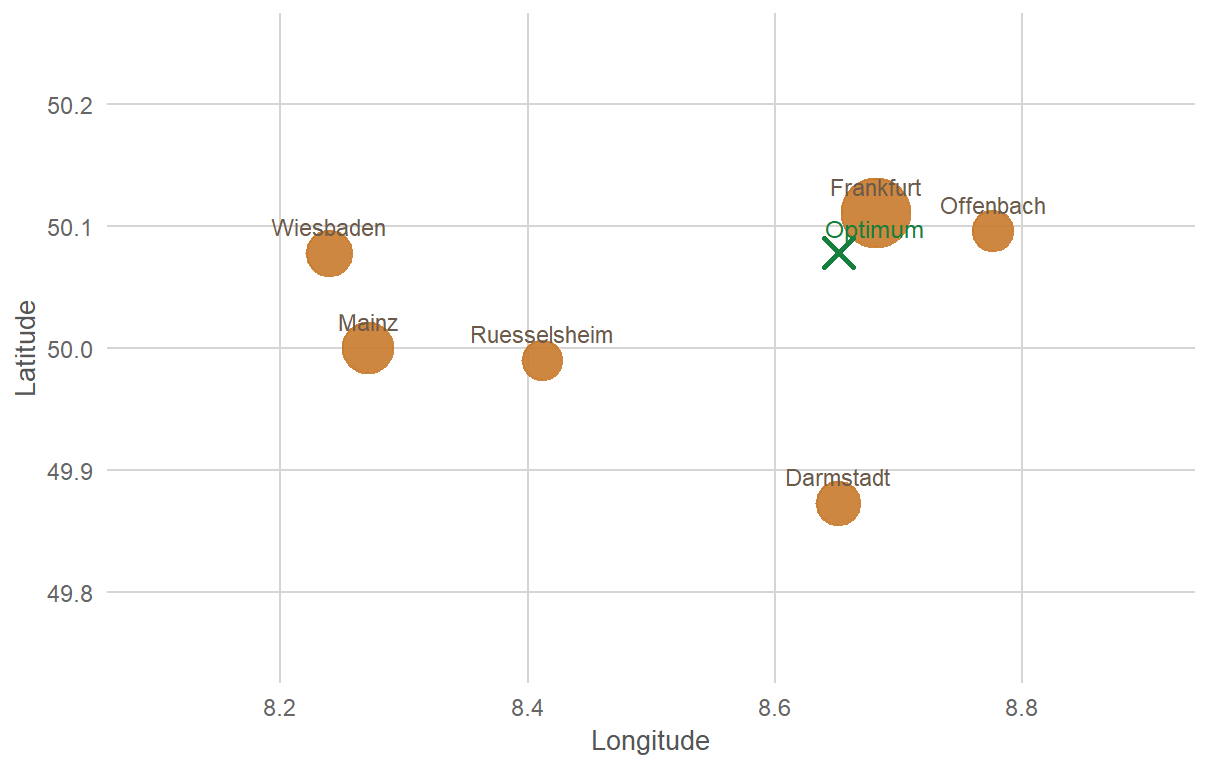
For the SushiFresh example: \[ (x^*, y^*) = (8.6512; 50.0782) \]
Strategic Design of Supply Chains
- Multi-criteria facility location planning
- Continuous facility location planning
- Discrete facility location planning
Learning objectives
After this unit, you will be able to …
- formulate discrete facility location and network design problems,
- model transport, transshipment and location decisions in a network,
- interpret key decision variables, objective functions and constraints,
- evaluate the results of discrete network models for strategic location decisions.
Further reading
- Transportation, transshipment and network models: (Günther and Tempelmeier 2012, chap. 4).
- Discrete location models, algorithms and applications: Chapters 1–4 in (Daskin 2013).
- Theory and applications of facility location: (Drezner and Hamacher 2002).
Planning Distribution Networks
Context
\(\rightarrow\) Select specific locations in the network \(\rightarrow\) usually a limited view of the SC
Case study – SushiFresh GmbH
Initial situation
Problem statement
SushiFresh GmbH supplies six supermarket stores in the Rhine-Main area daily with freshly produced sushi boxes. In Chapter 4, a qualitative pre-selection of locations using AHP was carried out (result: Mainz-Hechtsheim narrowly ahead), as well as a continuous location optimisation (centre of gravity/Weiszfeld). The question now is: does this result also hold up under a cost-based assessment?
Review of Chapter 4
- AHP evaluation: Raunheim narrowly ahead
- Centre of gravity / Weiszfeld: optimal point in the middle of the Rhine-Main area, near Raunheim
- Open question: does a cost optimisation (fixed costs + transport) confirm this picture?
Case study – SushiFresh GmbH
Decision situation
Decision situation
SushiFresh must decide which of the three candidate locations will be developed for production and distribution, and which store should be supplied from which location. The company wants to make this decision so that the annual total costs of fixed costs and transport are minimised. The following information is known:
Candidate locations and annual fixed costs
| ID | Location | Longitude | Latitude | Fixed costs/year (€1,000) |
|---|---|---|---|---|
| S1 | Wiesbaden-Erbenheim | 8.29990 | 50.06320 | 36 |
| S2 | Mainz-Hechtsheim | 8.28310 | 49.96980 | 42 |
| S3 | Raunheim | 8.46500 | 50.00000 | 52 |
| S4 | Höchst | 8.54218 | 50.11146 | 48 |
| S5 | Isenburg | 8.70720 | 50.05430 | 40 |
Transport distances in km
| C1 | C2 | C3 | C4 | C5 | C6 | |
|---|---|---|---|---|---|---|
| S1 | 6.174 | 20.739 | 23.737 | 27.576 | 42.998 | 9.110 |
| S2 | 4.603 | 25.745 | 29.584 | 44.289 | 36.928 | 39.002 |
| S3 | 24.084 | 13.601 | 8.518 | 27.325 | 22.386 | 6.296 |
| S4 | 30.588 | 33.354 | 44.696 | 16.751 | 34.263 | 37.121 |
| S5 | 25.113 | 43.756 | 45.288 | 30.370 | 16.021 | 5.700 |
Stores and daily demand
| ID | Store | Longitude | Latitude | Demand $\mu$ (boxes/day) |
|---|---|---|---|---|
| C1 | Wiesbaden | 8.2398 | 50.0782 | 120 |
| C2 | Mainz | 8.2711 | 50.0000 | 150 |
| C3 | Frankfurt | 8.6821 | 50.1109 | 280 |
| C4 | Rüsselsheim | 8.4116 | 49.9904 | 90 |
| C5 | Darmstadt | 8.6512 | 49.8728 | 110 |
| C6 | Offenbach | 8.7761 | 50.0956 | 95 |
Warehouse Location Problem
Problem description
Problem statement
Consider a set of customer locations and a set of (potential) warehouse locations. Each customer location has a demand for goods (e.g. in units per month/year) that must be supplied by the warehouses. Transporting the goods incurs distance-dependent transport costs. Opening a warehouse incurs set-up costs.
The decision is at which locations warehouses should be set up and which customers they should supply.
Notation
- Set of warehouses \(i \in I\)
- Set of customer locations \(j \in J\)
- Transport links \(E \subseteq I \times J\)
- Opening costs at warehouse location \(i\): \(f_i\)
- Transport costs (e.g. in €/month) from location \(i\) to customer \(j\): \(c_{ij}\)
- Demand of customer \(j\): \(a_j\)
Warehouse Location Problem
Mathematical model
Mixed-integer linear programming model
Minimise the total costs of transport and opening locations
\[\min \rightarrow \sum_{i \in I} y_i \cdot f_i + \sum_{(i,j) \in E} x_{ij} \cdot c_{ij}\]
Constraints \[ \begin{align} \sum_{(i,j) \in E} x_{ij} &= a_j & \forall j \in J &\quad\rightarrow \text{satisfy demand} \\ x_{ij} &\leq y_i \cdot a_j & \forall (i,j) \in E &\quad\rightarrow \text{transport only from opened locations} \\ x_{ij} &\geq 0 & \forall (i,j) \in E &\quad\rightarrow \text{transport quantities non-negative} \\ y_i &\in \{0,1\} & \forall i \in I &\quad\rightarrow \text{location is opened or not} \end{align} \]
Warehouse Location Problem
Case example
Locations – fixed costs \(f_i\) (€/year)
| Location i | f_i (€) |
|---|---|
| S1 | 36,000 |
| S2 | 42,000 |
| S3 | 52,000 |
| S4 | 48,000 |
| S5 | 40,000 |
Stores – demand \(a_j\) (boxes/year)
| Store j | a_j |
|---|---|
| C1 | 120,000 |
| C2 | 150,000 |
| C3 | 280,000 |
| C4 | 90,000 |
| C5 | 110,000 |
| C6 | 95,000 |
Transport costs \(c_{ij}\) (€/box)
| C1 | C2 | C3 | C4 | C5 | C6 | |
|---|---|---|---|---|---|---|
| S1 | 0.123 | 0.415 | 0.475 | 0.552 | 0.860 | 0.182 |
| S2 | 0.092 | 0.515 | 0.592 | 0.886 | 0.739 | 0.780 |
| S3 | 0.482 | 0.272 | 0.170 | 0.546 | 0.448 | 0.126 |
| S4 | 0.612 | 0.667 | 0.894 | 0.335 | 0.685 | 0.742 |
| S5 | 0.502 | 0.875 | 0.906 | 0.607 | 0.320 | 0.114 |
Warehouse Location Problem
Implementation with R/OMPR
library(ompr)
library(ompr.roi)
library(ROI.plugin.glpk)

# Problem data
n_I <- 5; n_J <- 6
f   <- c(36000, 42000, 52000, 48000, 40000)
a   <- c(120000, 150000, 280000, 90000, 110000, 95000)
c_ij <- matrix(
  c(
    0.12348,    0.41478,    0.47474,    0.55152,    0.85996,    0.18220,
    0.09206,    0.51490,    0.59168,    0.88578,    0.73856,    0.78004,
    0.48168,    0.27202,    0.17036,    0.54650,    0.44772,    0.12592,
    0.61176,    0.66708,    0.89392,    0.33502,    0.68526,    0.74242,
    0.50226,    0.87512,    0.90576,    0.60740,    0.32042,    0.11400),
  nrow = n_I, byrow = TRUE)

# MILP model
model <- MIPModel() |>
  # Variables
  add_variable(y[i], i = 1:n_I, type = "binary") |>
  add_variable(x[i,j], i = 1:n_I, j = 1:n_J,
               type = "continuous", lb = 0) |>
  # Objective function
  set_objective(
    sum_expr(f[i] * y[i], i = 1:n_I) +
    sum_expr(c_ij[i,j] * x[i,j],
             i = 1:n_I, j = 1:n_J),
    sense = "min") |>
  # C1: satisfy demand completely
  add_constraint(
    sum_expr(x[i,j], i = 1:n_I) == a[j],
    j = 1:n_J) |>
  # C2: transport only from opened warehouses
  add_constraint(
    x[i,j] <= y[i] * a[j],
    i = 1:n_I, j = 1:n_J)

result <- solve_model(model,
           with_ROI(solver = "glpk", verbose = FALSE))
OMPR – workflow
MIPModel()→ empty modeladd_variable()→ decision variablesset_objective()→ objective functionadd_constraint()→ constraintssolve_model()→ call solverget_solution()→ extract solution
Warehouse Location Problem
Case example – optimal solution
| Location $i$ | Store $j$ | Quantity $x_{ij}$ (boxes) | Transport costs (€) |
|---|---|---|---|
| S1 | C1 | 120,000 | 14,817.6 |
| S3 | C2 | 150,000 | 40,803.0 |
| S3 | C3 | 280,000 | 47,700.8 |
| S3 | C4 | 90,000 | 49,185.0 |
| S3 | C5 | 110,000 | 49,249.2 |
| S3 | C6 | 95,000 | 11,962.4 |
| Cost type | €/year |
|---|---|
| Fixed costs | 88,000 |
| Transport costs | 213,718 |
| Total costs Z* | 301,718 |
Warehouse Location Problem
Heuristic solution methods – basic ideas
Why heuristics?
The WLP is NP-hard: exact solvers (MILP) do find optimal solutions, but the computing time grows exponentially with \(|I|\) and \(|J|\). For large real-world instances, constructive heuristics are often the only practicable approach.
Basic idea
- start with a feasible solution and try to improve it step by step
- Each step: greedy – choose the change with the largest cost reduction
- Stop when no further improvement is possible
- Customers are always assigned to the cheapest open warehouse
Two classic approaches
| Method | Starting point | Direction |
|---|---|---|
| Add heuristic | No warehouses open | Add step by step |
| Drop heuristic | All warehouses open | Close step by step |
Basic ideas of add/drop – graphical
Warehouse Location Problem
Add heuristic
Idea: Start with no open warehouse. In each step, add the warehouse \(i^*\) that reduces the total costs the most.
Algorithm
Initialisation: \(S \leftarrow \emptyset\)
Repeat:
For each warehouse not yet opened \(i \notin S\), calculate the cost contribution: \[\Delta_i = Z(S) - Z(S \cup \{i\})\]
Choose \(i^* = \arg\max_{i \notin S} \Delta_i\)
If \(\Delta_{i^*} > 0\): open \(i^*\), set \(S \leftarrow S \cup \{i^*\}\)
Otherwise: stop
Assignment rule: Each customer \(j\) is assigned to the cheapest open warehouse: \(\sigma(j) = \arg\min_{i \in S} c_{ij}\)
Cost calculation
\[Z(S) = \underbrace{\sum_{i \in S} f_i}_{\text{Opening}} + \underbrace{\sum_{j \in J} \min_{i \in S} c_{ij} \cdot a_j}_{\text{Transport}}\]
- Properties:
- Greedy, not guaranteed to be optimal
- Transport costs decrease from step to step
- A new warehouse is opened if opening costs < transport cost savings
Stopping condition
The heuristic stops as soon as no further warehouse reduces the total costs.
Warehouse Location Problem
Drop heuristic
Idea: Start with all warehouses open. In each step, close the warehouse \(i^*\) whose closure reduces the total costs the most.
Algorithm
Initialisation: \(S \leftarrow I\)
Repeat:
For each warehouse still open \(i \in S\), calculate the cost contribution: \[\Delta_i = Z(S) - Z(S \setminus \{i\})\]
Choose \(i^* = \arg\max_{i \in S} \Delta_i\)
If \(\Delta_{i^*} > 0\): close \(i^*\), set \(S \leftarrow S \setminus \{i^*\}\)
Otherwise: stop
Assignment rule: \(\sigma(j) = \arg\min_{i \in S} c_{ij}\)
Comparison with add heuristic
| Feature | Add | Drop |
|---|---|---|
| Start | \(S = \emptyset\) | \(S = I\) |
| Direction | constructive | destructive |
| Starting costs | \(\infty\) (no warehouse) | \(\sum_i f_i + \ldots\) |
| Running time | \(\mathcal{O}(|I|^2 \cdot |J|)\) | \(\mathcal{O}(|I|^2 \cdot |J|)\) |
| Tendency | few warehouses | more warehouses |
Important
Neither heuristic is guaranteed to be optimal. They deliver feasible solutions; the solution quality depends heavily on the cost structure of the instance.
Warehouse Location Problem
Add heuristic – case example
| Step | Action | Open locations | Fixed costs (€) | Transport (€) | Total (€) |
|---|---|---|---|---|---|
| 1 | +S3 | {S3} | 52,000 | 256,702 | 308,702 |
| 2 | +S1 | {S1, S3} | 88,000 | 213,718 | 301,718 |
Store assignment per step:
| Step | C1 | C2 | C3 | C4 | C5 | C6 |
|---|---|---|---|---|---|---|
| 1 | S3 | S3 | S3 | S3 | S3 | S3 |
| 2 | S1 | S3 | S3 | S3 | S3 | S3 |
Add heuristic result: location \(\{S1, S3\}\) opened, \(Z_\text{Add} = 301 718\) €/year
Warehouse Location Problem
Drop heuristic – case example
| Step | Action | Open locations | Fixed costs (€) | Transport (€) | Total (€) |
|---|---|---|---|---|---|
| 0 | Start | {S1, S2, S3, S4, S5} | 218,000 | 175,779.0 | 393,779.0 |
| 1 | -S2 | {S1, S3, S4, S5} | 176,000 | 179,549.4 | 355,549.4 |
| 2 | -S4 | {S1, S3, S5} | 128,000 | 198,582.6 | 326,582.6 |
| 3 | -S5 | {S1, S3} | 88,000 | 213,718.0 | 301,718.0 |
Store assignment per step:
| Step | C1 | C2 | C3 | C4 | C5 | C6 |
|---|---|---|---|---|---|---|
| 0 | S2 | S3 | S3 | S4 | S5 | S5 |
| 1 | S1 | S3 | S3 | S4 | S5 | S5 |
| 2 | S1 | S3 | S3 | S3 | S5 | S5 |
| 3 | S1 | S3 | S3 | S3 | S3 | S3 |
Drop heuristic result: location \(\{S1, S3\}\) opened, \(Z_\text{Drop} = 301 718\) €/year — identical to the result of the add heuristic!
Warehouse Location Problem
Comparison of solutions
| Metric | Optimum (MILP) | Add heuristic | Drop heuristic |
|---|---|---|---|
| Opened locations | S1, S3 | S1, S3 | S1, S3 |
| Number of locations | 2 | 2 | 2 |
| Fixed costs (€) | 36000 | 88000 | 88000 |
| Transport costs (€) | 265718 | 213718 | 213718 |
| Total costs Z (€) | 301718 | 301718 | 301718 |
| Gap to optimum (%) | – | 0% | 0% |
In this case example, the add heuristic and the drop heuristic independently find the same, provably optimal solution (\(Z = 301 718\) €/year, only location S1 = Wiesbaden-Erbenheim). This is by no means a given, but here it shows the clear cost advantage of this location.
Cost comparison
Qualitative vs. Quantitative Location Assessment
Discussion
A contradiction with Chapter 4?
The AHP analysis in Chapter 4 narrowly favoured Mainz-Hechtsheim. The quantitative WLP analysis in this chapter favours Wiesbaden-Erbenheim and Raunheim. How do these fit together?
| Location (single site) | Fixed costs (€) | Transport (€/year) | Total (€/year) |
|---|---|---|---|
| Raunheim | 260,000 | 256,702.0 | 516,702.0 |
| Wiesbaden-Erbenheim | 180,000 | 371,503.2 | 551,503.2 |
Raunheim and Wiesbaden-Erbenheim have lower transport costs; the savings compensate for the higher fixed costs.
Conclusion
- AHP (Chapter 4): good for an initial pre-selection based on soft criteria that are hard to quantify
- WLP (Chapter 5): delivers the robust cost-based decision once hard figures are available
- The two methods complement each other – neither replaces the other
SushiFresh decision
Consolidation of the production site at Wiesbaden-Erbenheim. This decision is revisited in Chapter 6 (risk pooling) and Chapter 8 (bullwhip effect).
Uncertainty and Risk Management in Supply Chains
Uncertainty in Supply Chains
- Pooling
- Newsvendor model
- Bullwhip effect
Learning objectives
After this unit you will be able to …
- explain sources and effects of uncertainty in supply chains,
- distinguish between demand uncertainty, implied uncertainty and responsiveness,
- analyse the effect of risk pooling on demand variance and safety stocks,
- compare and assess centralised and decentralised inventory structures under uncertainty.
Further reading
- Pooling, demand variability and inventory decisions: (Cachon and Terwiesch 2024, chaps. 10–13).
- Safety stocks, service levels and inventory management: (Silver et al. 2017, chaps. 6–8).
Case study: SushiFresh GmbH
Six stores, one new central plant
Initial situation
SushiFresh GmbH is a fictitious regional producer of fresh sushi boxes in the Rhine-Main area, supplying six stores daily. In Chapter 5, the decision was made to consolidate production at one central site in Wiesbaden-Erbenheim. This chapter asks: how much safety stock is needed — decentralised vs. centralised?
| Store | μ (boxes/day) | σ |
|---|---|---|
| Wiesbaden | 120 | 25 |
| Mainz | 150 | 30 |
| Frankfurt | 280 | 55 |
| Rüsselsheim | 90 | 20 |
| Darmstadt | 110 | 24 |
| Offenbach | 95 | 22 |
Total demand: 845 boxes/day. Frankfurt (bold) is the largest and most volatile store.
The nature of uncertainty
Implied uncertainty in supply chains (Chopra and Meindl 2025)
Implied uncertainty denotes the uncertainty a supply chain must cope with — determined by the combination of demand uncertainty and the market’s service requirements (Chopra and Meindl 2025, Ch. 2).
Two sources of implied uncertainty
| Dimension | Low | High |
|---|---|---|
| Demand uncertainty | Salt, electricity | Fashion, electronics |
| Supply variability | Concrete, coal | Semiconductors, fishing |
\(\rightarrow\) High implied uncertainty requires responsive supply chains with buffer capacity.
The basic dilemma
- Demand is variable and hard to predict
- Capacities (plants, warehouses, staff) are fixed in advance
- \(\rightarrow\) A mismatch between supply and demand is structurally unavoidable
The nature of uncertainty
Mismatch: fluctuating demand vs. fixed capacity
Capacities (machines, staff, storage space) are determined ex ante. Demand materialises ex post. The result: a systematic mismatch in both directions.
Consequences of the mismatch
| Scenario | Phenomenon | Consequence |
|---|---|---|
| \(d > C\) | Overload | Lost sales, loss of revenue |
| \(d < C\) | Underutilisation | Idle costs |
| \(d \approx C\) | Equilibrium | with a perfect forecast |
Practical examples
- Automotive industry: plants produce only certain models for several years \(\rightarrow\) utilisation depends on demand
- Retail: seasonal goods (Christmas items) are ordered too early, leftovers are sold off cheaply
- Hospital: operating theatre capacities are fixed daily, emergency volume is highly variable
Dealing with uncertainty
Capacity pooling
Initial situation (structure following Cachon & Terwiesch, Ch. 17)
In its start-up phase, SushiFresh initially operated only 2 pilot kitchens for 2 pilot sites (today’s Wiesbaden and Mainz stores). Each kitchen is assigned exclusively to its own site – no flexibility. Capacity per kitchen is 90 boxes/day. Demand is uncertain and is observed after capacities have been fixed.
Consequences of inflexibility
- If demand exceeds capacity \(\rightarrow\) shortage (lost sales)
- If demand falls below capacity \(\rightarrow\) idle capacity
- Both effects reduce system performance
Capacity pooling
Original configuration – each kitchen supplies only its assigned store
Monthly demand and production, pilot phase (\(C^{Wi} = C^{Ma} = 90\))
| Month | dtWi | dtMa | xtWi | xtMa |
|---|---|---|---|---|
| 1 | 78 | 102.0 | 78.00 | 90.00 |
| 2 | 79 | 92.0 | 79.00 | 90.00 |
| 3 | 92 | 93.0 | 90.00 | 90.00 |
| 4 | 76 | 87.0 | 76.00 | 87.00 |
| 5 | 95 | 80.0 | 90.00 | 80.00 |
| 6 | 104 | 97.0 | 90.00 | 90.00 |
| 7 | 87 | 90.0 | 87.00 | 90.00 |
| 8 | 92 | 76.0 | 90.00 | 76.00 |
| 9 | 91 | 89.0 | 90.00 | 89.00 |
| 10 | 85 | 86.0 | 85.00 | 86.00 |
| 11 | 96 | 89.0 | 90.00 | 89.00 |
| 12 | 93 | 93.0 | 90.00 | 90.00 |
| ⌀ | 89 | 89.5 | 86.25 | 87.25 |
System Evaluation
- Expected demand: \(E(d^{Wi})=\) 89; \(E(d^{Ma})=\) 89.5
- Expected production: \(E(x^{Wi})=\) 86.2; \(E(x^{Ma})=\) 87.2
- Site utilisation: \(\frac{E(x^{Wi})}{C^{Wi}}=\) 95.8%; \(\frac{E(x^{Ma})}{C^2}=\) 96.9%
- Expected fill rate: \(\frac{E(x^{Wi})}{E(d^{Wi})}=\) 97.2%; \(\frac{E(x^{Ma})}{E(d^{Ma})}=\) 97.7%
Problem
Utilisation and fill rate are high, yet there are lost sales and underutilisation \(\rightarrow\) Can helping each other out (capacity pooling) improve these KPIs?
Capacity pooling
One-sided pooling – the Wiesbaden kitchen can supply both sites
| Month | dtWi | dtMa | xtWi,Wi | xtWi,Ma | xt2B |
|---|---|---|---|---|---|
| 1 | 78 | 102 | 78 | 12 | 90 |
| 2 | 79 | 92 | 79 | 2 | 90 |
| 3 | 92 | 93 | 90 | 0 | 90 |
| 4 | 76 | 87 | 76 | 0 | 87 |
| 5 | 95 | 80 | 90 | 0 | 80 |
| 6 | 104 | 97 | 90 | 0 | 90 |
| 7 | 87 | 90 | 87 | 0 | 90 |
| 8 | 92 | 76 | 90 | 0 | 76 |
| 9 | 91 | 89 | 90 | 0 | 89 |
| 10 | 85 | 86 | 85 | 0 | 86 |
| 11 | 96 | 89 | 90 | 0 | 89 |
| 12 | 93 | 93 | 90 | 0 | 90 |
Pooling rule (if \(d_t^{Ma} > C^{Ma}\) and \(d_t^{Wi} < C^{Wi}\)):
\[x_t^1 = d_t^{Wi} + \min(C^{Wi} - d_t^{Wi};\; d_t^{Ma} - C^{Ma})\] \[x_t^{Ma,Ma} = C^{Ma}\]
System Evaluation (Pooling)
- Production plant 1: \(E(x^{Wi})=\) 87.4
- Supply to market B: \(E(x^{Wi,Ma}+x^{Ma,Ma})=\) 88.4
- Utilisation plant 1: \(\frac{E(x^{Wi})}{C^{Wi}}=\) 97.1%
- Fill rate market B: \(\frac{E(x^{Wi,Ma}+x^{Ma,Ma})}{E(d^{Ma})}=\) 98.8%
Capacity pooling
Two-sided pooling – both kitchens can supply both sites
| Month | dtWi | dtMa | xtWi,Wi | xtWi,Ma | xtMa,Ma | xtMa,Wi |
|---|---|---|---|---|---|---|
| 1 | 78 | 102 | 78 | 12 | 90 | 0 |
| 2 | 79 | 92 | 79 | 2 | 90 | 0 |
| 3 | 92 | 93 | 90 | 0 | 90 | 0 |
| 4 | 76 | 87 | 76 | 0 | 87 | 0 |
| 5 | 95 | 80 | 90 | 0 | 80 | 5 |
| 6 | 104 | 97 | 90 | 0 | 90 | 0 |
| 7 | 87 | 90 | 87 | 0 | 90 | 0 |
| 8 | 92 | 76 | 90 | 0 | 76 | 2 |
| 9 | 91 | 89 | 90 | 0 | 89 | 1 |
| 10 | 85 | 86 | 85 | 0 | 86 | 0 |
| 11 | 96 | 89 | 90 | 0 | 89 | 1 |
| 12 | 93 | 93 | 90 | 0 | 90 | 0 |
System Evaluation
- Production Wiesbaden: \(E(x^{Wi})=\) 87.4
- Production Mainz: \(E(x^{Ma})=\) 88
- Supply to Wiesbaden: \(E(x^{Wi, Wi}+x^{Ma, Wi})=\) 87
- Supply to Mainz: \(E(x^{Wi,Ma}+x^{Ma, Ma})=\) 88.4
- Utilisation Wiesbaden: \(\frac{E(x^{Wi})}{C^{Wi}}=\) 97.1%
- Utilisation plant 2: \(\frac{E(x^{Ma})}{C^{Ma}}=\) 97.8%
- Fill rate Wiesbaden: \(\frac{E(x^{Wi,Wi}+x^{Ma,Wi})}{E(d^{Wi})}=\) 97.8%
- Fill rate Mainz: \(\frac{E(x^{Ma,Ma}+x^{Wi,Ma})}{E(d^{Ma})}=\) 98.8%
The supply system behaves as if the separation between markets/products and plants were removed \(\rightarrow\) total capacity and total demand are decisive
Capacity pooling
KPI comparison
| KPI | Decentralised | One-sided pooling | Two-sided pooling |
|---|---|---|---|
| Ø Production Wiesbaden (units) | 86.2 | 87.4 | 87.4 |
| Ø Production Mainz (units) | 87.2 | 87.2 | 88.0 |
| Ø Sales Wiesbaden (units) | 86.2 | 86.2 | 87.0 |
| Ø Sales Mainz (units) | 87.2 | 88.4 | 88.4 |
| Lost sales Wiesbaden (units) | 33.0 | 33.0 | 24.0 |
| Lost sales Mainz (units) | 27.0 | 13.0 | 13.0 |
| Utilisation Wiesbaden (%) | 95.8 | 95.8 | 96.7 |
| Utilisation Mainz (%) | 96.9 | 98.2 | 98.2 |
| Sales ratio Wiesbaden (%) | 96.9 | 96.9 | 97.8 |
| Sales ratio Mainz (%) | 97.5 | 98.8 | 98.8 |
Benefits of capacity pooling
Capacity pooling improves all service KPIs at once: more sales, higher utilisation, less idle capacity – without additional production capacity.
Costs of capacity pooling
However, capacity pooling requires additional logistics capacity and, above all, technological flexibility
Capacity pooling
Chaining
Chaining
Capacity pooling enables capacities to be shared across different markets. However, it requires technological and logistical flexibility. The more markets and products that need to be served, the more complex and costly capacity pooling becomes. So the question is: how can capacity pooling be organised for multiple products and markets?
Full chaining
Links: \(n \cdot n = 16\)
Technologies per plant: \(n=4\)
Markets per plant: \(n=4\)
Short chaining
Links: \(2 \cdot n = 8\)
Technologies per plant: \(n=2\)
Markets per plant: \(n=2\)
Long chaining
Links: \(2 \cdot n = 8\)
Technologies per plant: \(n=2\)
Markets per plant: \(n=4\)
Dealing with uncertainty
Pooling over time - safety stocks
Definition of safety stock (recap)
Safety stocks buffer demand fluctuations over time. Let \(S\) be the initial inventory at the start of the risk period and \(\mu\) the expected demand in the risk period; then the safety stock \(sb\) is: \(sb = S - \mu\)
Example: the Wiesbaden-Erbenheim central plant periodically orders crates of fresh salmon fillet from the fish wholesaler.
Setting safety stocks
- by cost: safety stocks incur inventory holding costs and avoid shortage costs \(\rightarrow\) cost trade-off
- Service readiness: protection against the risk of being unable to deliver during the risk period (\(\alpha\) service level)
- Fill rate: share of demand to be met within the risk period in the long run (\(\beta\) service level)
Safety stocks
\(\alpha\) service level and empirical distribution function
Assume that a stockout risk of 5% is acceptable, so the \(\alpha\) service level is 95%. Question: which (minimum) initial inventory ensures this service level? Answer: Formally, \(P(d \leq S) \geq \alpha\) must hold. For an empirical demand distribution \(F(d)\) we therefore need \(\hat{F}(S) \geq \alpha\) or \(S \geq \hat{F}^{-1}(\alpha)\). So we are looking for an (empirical) quantile.
| Rank | dt | Count | F̂(d) |
|---|---|---|---|
| 1 | 76 | 1 | 8.3% |
| 2 | 78 | 1 | 16.7% |
| 3 | 79 | 1 | 25% |
| 4 | 85 | 1 | 33.3% |
| 5 | 87 | 1 | 41.7% |
| 6 | 91 | 1 | 50% |
| 7 | 92 | 2 | 66.7% |
| 8 | 93 | 1 | 75% |
| 9 | 95 | 1 | 83.3% |
| 10 | 96 | 1 | 91.7% |
| 11 | 104 | 1 | 100% |
Safety stocks \(sb=S-\mu\): \(sb_{75\%}=4\), \(sb_{90\%}=7\), \(sb_{95\%}=15\)
Inventory pooling
Safety stocks with decentralised and centralised inventory holding
Decentralised network
Centralised network (pooling)
Safety stock savings: \(sb_{decentral}=sb_{A}+sb_{B}=27.5\) vs. \(sb_{0}=22.5\) \(\rightarrow\) 5 units or 18%
Inventory pooling
Safety stocks with a known demand distribution
Demand distribution
It is often assumed that demand for goods in a given time span is a random variable whose distribution parameters (such as mean and variance) are known or can be estimated. Real data often deviate from this — simulated using the example of Frankfurt/Offenbach with occasional, shared holiday peaks.
Data basis: simulated daily demand over 250 days (set.seed(616), see R code for details)
- ECDF (solid) = empirical distribution
- Normal distribution (dotted) = parametric model
| Store | μ̂ | σ̂ | KS p-value | emp. SS (α=95%) | param. SS |
|---|---|---|---|---|---|
| Frankfurt | 294 | 65 | 0.000 | 366 | 400 |
| Offenbach | 95 | 23 | 0.001 | 120 | 132 |
The shared holiday peaks produce a right-skewed distribution in both stores that deviates clearly from the normal distribution (KS test: p < 0.01 for both) — accordingly, the empirical safety stock turns out lower than the parametric one.
Inventory pooling
Normally distributed demand – safety stock for two sites
Let \(D_1 \sim \mathcal{N}(\mu_1, \sigma_1^2)\) and \(D_2 \sim \mathcal{N}(\mu_2, \sigma_2^2)\) be the normally distributed demands at two sites with correlation \(\rho = \text{Cor}(D_1, D_2)\).
The safety stock at site \(i\) for an \(\alpha\) service level is: \(sb_i = z_\alpha \cdot \sigma_i\), so that in total: \(sb_{dec} = z_\alpha \cdot (\sigma_1 + \sigma_2)\)
Central warehouse: distribution of total demand
The aggregated demand \(D_0 = D_1 + D_2\) is also normally distributed:
\[D_0 \sim \mathcal{N}\!\left(\mu_1 + \mu_2,\; \sigma_1^2 + \sigma_2^2 + 2\rho\,\sigma_1\sigma_2\right)\]
Hence the central safety stock is:
\[sb_{cen} = z_\alpha \cdot \sqrt{\sigma_1^2 + \sigma_2^2 + 2\rho\,\sigma_1\sigma_2}\]
Comparison: decentralised vs. centralised
| Configuration | Safety stock |
|---|---|
| Decentralised (2 warehouses) | \(z_\alpha \cdot (\sigma_1 + \sigma_2)\) |
| Centralised (\(\rho = -1\)) | \(z_\alpha \cdot \|\sigma_1 - \sigma_2\|\) |
| Centralised (\(\rho = 0\)) | \(z_\alpha \cdot \sqrt{\sigma_1^2 + \sigma_2^2}\) |
| Centralised (\(\rho = +1\)) | \(z_\alpha \cdot (\sigma_1 + \sigma_2)\) |
\(\rightarrow\) \(\|\sigma_1 - \sigma_2\| \leq \sqrt{\sigma_1^2 + \sigma_2^2} \leq \sigma_1 + \sigma_2\) \(\rightarrow\) Pooling pays off as long as \(\rho < 1\)
The smaller the correlation \(\rho\), the greater the savings potential from central pooling. (risk-balancing effect)
Key result
Safety stock for all six SushiFresh stores (\(\alpha = 95\%\))
Verified with qnorm()
- \(z_{0.95} =\) 1.645
- Decentralised: \(sb_{dec}=z_\alpha\sum\sigma_i=\) 289.5 boxes
- Centralised (pooled, independent): \(sb_{cen}=z_\alpha\sqrt{\sum\sigma_i^2}=\) 127.5 boxes
- Savings from consolidation: 56%
Cross-check pooling_safety_stock(): for 6 identical stores with \(\bar\sigma=\) 29.3 the savings would be 59% — more than the actual 56%. The dominant, volatile Frankfurt site (\(\sigma=55\)) reduces the relative pooling advantage compared with the idealised case of equally sized sites.
56.0% less safety stock through centralisation at Wiesbaden-Erbenheim — at an identical service level.
Inventory pooling
Empirical illustration
Negative correlation \(\rho = -0.8\)
No correlation \(\rho = 0\)
Positive correlation \(\rho = +0.8\)
With negative correlation, the fluctuations in \(D_0\) dampen each other — total demand is more stable than the individual demands. With positive correlation, they reinforce each other.
Inventory pooling
Safety stock as a function of the correlation \(\rho\)
Three scenarios (Frankfurt \(\sigma_1=25\), Offenbach \(\sigma_2=30\), \(\alpha = 95\%\))
| \(\rho\) | \(sb_{cen}\) | Savings |
|---|---|---|
| \(-0.8\) | 29.7 | 67.2% |
| \(\;\;\;0\) | 64.2 | 29% |
| \(+0.8\) | 85.9 | 5.1% |
| \((+1)\) | 90.5 | 0% |
\(sb_{dec} = z_\alpha \cdot (\sigma_1 + \sigma_2) =\) 90.5
Centralisation gain if \(\sigma_1 \neq \sigma_2\)
\[1-\frac{sb_{cen}}{sb_{dec}} = 1-\frac{\sqrt{\sigma_1^2 + \sigma_2^2 + 2\rho\,\sigma_1\sigma_2}}{\sigma_1 + \sigma_2}\]
Centralisation gain if \(\sigma_1 = \sigma_2\)
\[1-\frac{sb_{cen}}{sb_{dec}} = 1-\sqrt{\frac{1+\rho}{2}}\]
Inventory pooling
Simulated daily demand: Frankfurt & Offenbach
| KPI | Frankfurt | Offenbach | Total / pool |
|---|---|---|---|
| μ̂ | 294.1 | 94.9 | 389 |
| σ̂ | 64.7 | 22.8 | 79.6 |
| SS decentralised (emp.) | 71.5 | 25.1 | 96.6 |
| SS centralised (emp.) | — | — | 80.5 |
| Savings (emp.) | — | — | 16.7% |
| SS decentralised (norm.) | 106.4 | 37.5 | 143.9 |
| SS centralised (norm.) | — | — | 130.8 |
| Savings (norm.) | — | — | 9.1% |
Correlation \(\hat{\rho} =\) 0.55 \(\rightarrow\) pooling savings, empirical: 16.7%, parametric: 9.1%
Aside: normal distribution
Probability density function & cumulative distribution function
Formal definition
The density function \(f(x)\) gives the relative frequency with which a value \(x\) occurs, and the cumulative distribution function \(F(x)\) is the cumulative probability:
\[f(x) = \frac{1}{\sigma\sqrt{2\pi}}\,\exp\!\left(-\frac{(x-\mu)^2}{2\sigma^2}\right) \qquad F(x) = P(X \leq x) = \int_{-\infty}^{x} f(t)\,dt\]
Symmetry property and 68–95–99.7 rule:
\[F(-z) = 1 - F(z)\]
| Range of values | Probability |
|---|---|
| \(\mu \pm 1\sigma\) | ≈ 68.3% |
| \(\mu \pm 2\sigma\) | ≈ 95.4% |
| \(\mu \pm 3\sigma\) | ≈ 99.7% |
Aside: standard normal distribution
z-transformation & standardisation
The z-transformation converts any normal distribution \(X \sim \mathcal{N}(\mu, \sigma^2)\) into the standard normal distribution \(Z \sim \mathcal{N}(0, 1)\):
\[Z = \frac{X - \mu}{\sigma} \quad \Rightarrow P(X \leq x) = P\!\left(Z \leq \frac{x-\mu}{\sigma}\right) = \Phi(z)\] \(\rightarrow\) all \(\mathcal{N}(\mu, \sigma^2)\) can be reduced to one table — the standard normal distribution table \(\Phi(z)\)
Important quantiles of \(\mathcal{N}(0,1)\):
| Service level \(\alpha\) | \(z_\alpha = \Phi^{-1}(\alpha)\) |
|---|---|
| 90.0% | 1.282 |
| 95.0% | 1.645 |
| 97.5% | 1.960 |
| 99.0% | 2.326 |
| 99.9% | 3.090 |
Aside: quantile/distribution table
Reading \(\Phi(z)\) and its inverse \(z_\alpha = \Phi^{-1}(\alpha)\)
| +0.00 | +0.01 | +0.02 | +0.03 | +0.04 | +0.05 | +0.06 | +0.07 | +0.08 | +0.09 | |
|---|---|---|---|---|---|---|---|---|---|---|
| 0.0 | 0.5000 | 0.5040 | 0.5080 | 0.5120 | 0.5160 | 0.5199 | 0.5239 | 0.5279 | 0.5319 | 0.5359 |
| 0.1 | 0.5398 | 0.5438 | 0.5478 | 0.5517 | 0.5557 | 0.5596 | 0.5636 | 0.5675 | 0.5714 | 0.5753 |
| 0.2 | 0.5793 | 0.5832 | 0.5871 | 0.5910 | 0.5948 | 0.5987 | 0.6026 | 0.6064 | 0.6103 | 0.6141 |
| 0.3 | 0.6179 | 0.6217 | 0.6255 | 0.6293 | 0.6331 | 0.6368 | 0.6406 | 0.6443 | 0.6480 | 0.6517 |
| 0.4 | 0.6554 | 0.6591 | 0.6628 | 0.6664 | 0.6700 | 0.6736 | 0.6772 | 0.6808 | 0.6844 | 0.6879 |
| 0.5 | 0.6915 | 0.6950 | 0.6985 | 0.7019 | 0.7054 | 0.7088 | 0.7123 | 0.7157 | 0.7190 | 0.7224 |
| 0.6 | 0.7257 | 0.7291 | 0.7324 | 0.7357 | 0.7389 | 0.7422 | 0.7454 | 0.7486 | 0.7517 | 0.7549 |
| 0.7 | 0.7580 | 0.7611 | 0.7642 | 0.7673 | 0.7704 | 0.7734 | 0.7764 | 0.7794 | 0.7823 | 0.7852 |
| 0.8 | 0.7881 | 0.7910 | 0.7939 | 0.7967 | 0.7995 | 0.8023 | 0.8051 | 0.8078 | 0.8106 | 0.8133 |
| 0.9 | 0.8159 | 0.8186 | 0.8212 | 0.8238 | 0.8264 | 0.8289 | 0.8315 | 0.8340 | 0.8365 | 0.8389 |
| 1.0 | 0.8413 | 0.8438 | 0.8461 | 0.8485 | 0.8508 | 0.8531 | 0.8554 | 0.8577 | 0.8599 | 0.8621 |
| 1.1 | 0.8643 | 0.8665 | 0.8686 | 0.8708 | 0.8729 | 0.8749 | 0.8770 | 0.8790 | 0.8810 | 0.8830 |
| 1.2 | 0.8849 | 0.8869 | 0.8888 | 0.8907 | 0.8925 | 0.8944 | 0.8962 | 0.8980 | 0.8997 | 0.9015 |
| 1.3 | 0.9032 | 0.9049 | 0.9066 | 0.9082 | 0.9099 | 0.9115 | 0.9131 | 0.9147 | 0.9162 | 0.9177 |
| 1.4 | 0.9192 | 0.9207 | 0.9222 | 0.9236 | 0.9251 | 0.9265 | 0.9279 | 0.9292 | 0.9306 | 0.9319 |
| 1.5 | 0.9332 | 0.9345 | 0.9357 | 0.9370 | 0.9382 | 0.9394 | 0.9406 | 0.9418 | 0.9429 | 0.9441 |
| 1.6 | 0.9452 | 0.9463 | 0.9474 | 0.9484 | 0.9495 | 0.9505 | 0.9515 | 0.9525 | 0.9535 | 0.9545 |
| 1.7 | 0.9554 | 0.9564 | 0.9573 | 0.9582 | 0.9591 | 0.9599 | 0.9608 | 0.9616 | 0.9625 | 0.9633 |
| 1.8 | 0.9641 | 0.9649 | 0.9656 | 0.9664 | 0.9671 | 0.9678 | 0.9686 | 0.9693 | 0.9699 | 0.9706 |
| 1.9 | 0.9713 | 0.9719 | 0.9726 | 0.9732 | 0.9738 | 0.9744 | 0.9750 | 0.9756 | 0.9761 | 0.9767 |
| 2.0 | 0.9772 | 0.9778 | 0.9783 | 0.9788 | 0.9793 | 0.9798 | 0.9803 | 0.9808 | 0.9812 | 0.9817 |
| 2.1 | 0.9821 | 0.9826 | 0.9830 | 0.9834 | 0.9838 | 0.9842 | 0.9846 | 0.9850 | 0.9854 | 0.9857 |
| 2.2 | 0.9861 | 0.9864 | 0.9868 | 0.9871 | 0.9875 | 0.9878 | 0.9881 | 0.9884 | 0.9887 | 0.9890 |
| 2.3 | 0.9893 | 0.9896 | 0.9898 | 0.9901 | 0.9904 | 0.9906 | 0.9909 | 0.9911 | 0.9913 | 0.9916 |
| 2.4 | 0.9918 | 0.9920 | 0.9922 | 0.9925 | 0.9927 | 0.9929 | 0.9931 | 0.9932 | 0.9934 | 0.9936 |
| 2.5 | 0.9938 | 0.9940 | 0.9941 | 0.9943 | 0.9945 | 0.9946 | 0.9948 | 0.9949 | 0.9951 | 0.9952 |
| 2.6 | 0.9953 | 0.9955 | 0.9956 | 0.9957 | 0.9959 | 0.9960 | 0.9961 | 0.9962 | 0.9963 | 0.9964 |
| 2.7 | 0.9965 | 0.9966 | 0.9967 | 0.9968 | 0.9969 | 0.9970 | 0.9971 | 0.9972 | 0.9973 | 0.9974 |
| 2.8 | 0.9974 | 0.9975 | 0.9976 | 0.9977 | 0.9977 | 0.9978 | 0.9979 | 0.9979 | 0.9980 | 0.9981 |
| 2.9 | 0.9981 | 0.9982 | 0.9982 | 0.9983 | 0.9984 | 0.9984 | 0.9985 | 0.9985 | 0.9986 | 0.9986 |
| 3.0 | 0.9987 | 0.9987 | 0.9987 | 0.9988 | 0.9988 | 0.9989 | 0.9989 | 0.9989 | 0.9990 | 0.9990 |
Reading the table:
Wanted: \(P(X \leq x)\) for \(X \sim \mathcal{N}(\mu, \sigma^2)\)
- Compute \(z = (x - \mu)/\sigma\)
- Row = first decimal place of \(z\)
- Column = second decimal place of \(z\)
- Table value = \(\Phi(z)\)
Inventory example:
\(D \sim \mathcal{N}(500, 80^2)\), service level \(\alpha = 95\%\)
\[z_{0.95} = \Phi^{-1}(0.95) = 1.645\]
\[\Rightarrow\; \text{SS} = z_\alpha \cdot \sigma = 1.645 \cdot 80 \approx \mathbf{132\;\text{units}}\]
Uncertainty in Supply Chains
- Risk pooling
- Newsvendor model
- Bullwhip effect
Learning objectives
After this unit you will be able to …
- classify the newsvendor problem as a one-off ordering decision under uncertain demand,
- determine overage and underage costs,
- derive and interpret the critical fractile rule,
- calculate an optimal order quantity for a given demand distribution,
- explain the influence of key model parameters on the ordering decision.
Further reading
- Introduction to the newsvendor model: (Thonemann 2023, chap. 5).
- Single-period inventory models and critical fractile logic: (Cachon and Terwiesch 2024, chap. 13).
- Newsvendor models in the context of inventory management: (Silver et al. 2017, chap. 9).
Case example
Sushi boxes in the supermarket
Every day, a supermarket sources freshly produced sushi boxes from SushiFresh GmbH, a regional sushi producer in the Rhine-Main region.
- The boxes are prepared in the morning and delivered before the store opens.
- Demand is uncertain until the evening. Replenishment during the day is not possible.
- Unsold sushi boxes may not be sold at regular price on the following day.
Decision question: How many sushi boxes should the supplier prepare?
Case example
Cost and revenue structure
The following simplified values apply to a sushi box:
| Quantity | Meaning | Value |
|---|---|---|
| Selling price \(p\) | Revenue per sushi box sold | €10 |
| Production and delivery costs \(c\) | Cost per sushi box prepared | €5 |
| Salvage value \(v\) | Revenue from evening discount or disposal | €2 |
In general, typically: \(p > c > v\)
\(\rightarrow\) Contribution margin per sushi box sold: \(c^u=p-c = 10-5=5\) €
\(\rightarrow\) Salvage loss per unsold sushi box: \(c^o=c-v=5-2=3\) €
Case example
Two possible situations from the supplier’s perspective
Too many boxes:
- less demand \(D\) than sushi boxes produced \(q\) \(\rightarrow\) excess stock \(q-D\)
- quantity sold: \(\min(D,q) = D\)
- contribution margin from sales: \(D \cdot c^u\)
- additional salvage costs: \((q-D) \cdot c^o\)
Total contribution margin: \(P(D,q)= D \cdot c^u - (q - D) \cdot c^o\)
Too few boxes:
- more demand \(D\) than sushi boxes produced \(q\) \(\rightarrow\) shortage \(D-q\)
- quantity sold: \(\min(D,q) = q\)
- total contribution margin: \(q \cdot c^u\)
- opportunity costs from lost contribution margin: \((D-q) \cdot c^u\)
Total contribution margin: \(P(D,q) = q \cdot c^u\)
Case example
Possible demand & production quantity
As a simplified miniature example (e.g. for a small store or a test sale), SushiFresh first estimates four possible demand scenarios from sales history, day of the week, weather forecast and current promotions:
| Demand \(D\) | Probability \(P(D=d)\) | Cumulative probability \(F(d)\) |
|---|---|---|
| 30 sushi boxes | 0.20 | 0.20 |
| 40 sushi boxes | 0.35 | 0.55 |
| 50 sushi boxes | 0.30 | 0.85 |
| 60 sushi boxes | 0.15 | 1.00 |
Which quantity should the supplier prepare in the morning: 30, 40, 50 or 60 sushi boxes?
Case example
Expected result
Set \(q=40\) sushi boxes
| Demand \(D\) | Prob. \(P(D=d)\) | Excess stock \(q-D\) | Shortage \(q-D\) | Contri-bution \(P\) |
|---|---|---|---|---|
| 30 sushi boxes | 0.20 | 10 | 0 | €120 |
| 40 sushi boxes | 0.35 | 0 | 0 | €200 |
| 50 sushi boxes | 0.30 | 0 | 10 | €200 |
| 60 sushi boxes | 0.15 | 0 | 20 | €200 |
Expected total contribution margin: \(\begin{align} E(P|q=40)= & 0.2 \cdot 120 + 0.35 \cdot 200 + \\ & 0.30 \cdot 200 + 0.15 \cdot 200= 184 \end{align}\)
\(E(P|q)\) for all \(q\)
\(\rightarrow\) maximum expected contribution margin at \(q=50\) with € 190 per day
Newsvendor model
Derivation of the objective function
Overage \(q > D\)
\[P(D,q) = D \cdot c^u - (q-D)^+\cdot c^o\]
\[\Downarrow\]
Underage \(q < D\)
\[P(D,q) = q \cdot c^u\]
\[\Downarrow\]
\[\begin{align} P(D,q) =& \min(D,q) \cdot c^u - (q-D)^+ \cdot c^o \\ = & (D-(D-q)^+) \cdot c^u - (q-D)^+ \cdot c^o \\ = & \underset{\text{contribution margin}}{D \cdot c^u} - \underset{\text{ shortage costs}}{(D-q)^+ \cdot c^u} - \underset{\text{excess stock costs}}{(q-D)^+ \cdot c^o} \end{align} \] where \((q-D)^+ = \max(0,q-D)\), \((D-q)^+ = \max(0,D-q)\) and \(\min(D,q) = D - (D-q)^+\)
Newsvendor model
Formal model
Problem description
Find the order quantity \(q\) that maximises expected profit or minimises expected costs: \[ \underset{q}{\max} E(P(q)) = \mu \cdot c^u - E((D-q)^+) \cdot c^u - E((q-D)^+) \cdot c^o \; \Leftrightarrow \; \underset{q}{\min} E(C(q)) = E((D-q)^+) \cdot c^u + E((q-D)^+) \cdot c^o \] \(\rightarrow\) minimise the weighted average of expected shortage \(E((D-q)^+)\) and expected excess stock \(E((q-D)^+)\)
Discrete demand (cf. previous slide)
Continuous demand (Frankfurt store) \(D \sim N(280,55^2)\)
Newsvendor model
Formal solution
The optimal order quantity \(q^*\) is where the slopes of the expected shortage costs \(E((D-q)^+) \cdot c^u\) and the excess stock costs \(E((q-D)^+)\cdot c^o\) are equal: \[ \left(1 - F(q^*)\right) \cdot c^u \overset{!}{=} F(q^*) \cdot c^o \quad \Longrightarrow \quad q^* = F^{-1} \left( \frac{c^u}{c^o + c^u} \right)\]
Discrete demand (distribution parameters cf. previous slide) with \(c^u = 5\) and \(c^o=3\)
Continuous demand (Frankfurt store) \(D \sim N(280,55^2)\) with \(c^u = 5\) and \(c^o=3\)
Newsvendor model
Critical ratio
Critical ratio
The optimal order quantity is the demand quantile whose cumulative probability equals the ratio of shortage costs to total costs. The critical ratio thus determines the willingness to take risks
\[ CR = \frac{c^u}{c^o + c^u}\]
Case 1: \(c^u < c^o\)
- Shortage costs are lower than excess stock costs
- Excess stock should be avoided
- \(\rightarrow\) opt. order quantity \(q^*\) smaller than the median of the demand distribution
Case 2: \(c^u = c^o\)
- Shortage costs = excess stock costs
- Shortages and excess stock equally important
- \(\rightarrow\) opt. order quantity \(q^*\) equals the median of the demand distribution
Case 3: \(c^u > c^o\)
- Shortage costs are higher than excess stock costs
- Shortages should be avoided
- \(\rightarrow\) opt. order quantity \(q^*\) larger than the median of the demand distribution
Newsvendor model
Optimal solution under normal distribution
Normally distributed demand
For normally distributed demand with \(D \sim (\mu,\sigma^2)\), the optimal order quantity can be calculated by transforming to the standard normal distribution. For the optimal order quantity and costs: \[z^* = \Phi^{-1} \left( \frac{c^u}{c^o + c^u} \right) \qquad q^*=\mu + \sigma \cdot z^* \qquad E(C(q^*))=(c^u+c^o)\cdot \sigma \cdot \varphi\left( z^* \right) \]
Case example Frankfurt store with \(N(280,55^2)\)
Case 1: \(c^u=1 < 5=c^o\)
\(q^* = 280 + 55 \cdot\) -0.97=226.8
Case 2: \(c^u = 3 = c^o\)
\(q^* = 280 + 55 \cdot\) 0=280
Case 3: \(c^u=5 > 1=c^o\)
\(q^* = 280 + 55 \cdot\) 0.97=333.2
Newsvendor model
Typical applications
Prerequisites
The newsvendor model is used particularly often when demand cannot be smoothed through inventory holding and shortage costs can be determined well
Typical areas of application include, e.g.
- seasonal and promotional items
- fresh products with a short shelf life
- tickets for events or transport
- …
Important
Beyond that, it is the basis for calculating cost-optimal safety stocks in inventory systems.
Uncertainty in supply chains
- Risk pooling
- Newsvendor model
- Bullwhip effect
Learning objectives
After this unit you will be able to …
- explain the bullwhip effect along a supply chain
- assess the main causes and consequences of the bullwhip effect
- determine the order-up-to level \(S\) and safety stock \(SB\)
- classify measures to reduce the bullwhip effect
Further reading
- Fundamental causes of and countermeasures to the bullwhip effect: (Thonemann 2023, chap. 8, especially 8.2).
- Empirical study of information transmission: (Bray and Mendelson 2012).
- Measurement, aggregation and impact of bullwhip effects: (Yao et al. 2020).
Case example: sushi boxes
Continued
The SushiFresh supply chain
SushiFresh GmbH is a regional producer of fresh sushi boxes and supplies six supermarket stores in the Rhine-Main area. For production, SushiFresh depends on daily deliveries of fresh fish fillets supplied by the fish wholesaler Nord-Fisch KG. The sushi supply chain is therefore structured as follows:
\[ \text{Supermarket stores} \mathrel{ \mathop{\leftrightharpoons} \limits^{\text{Delivery}}_{\text{Order}} } \text{SushiFresh GmbH} \mathrel{ \mathop{\leftrightharpoons} \limits^{\text{Delivery}}_{\text{Order}} } \text{Nord-Fisch KG} \]
Supermarket stores
- observe end-customer demand (e.g. Frankfurt store: \(\mu=280\), \(\sigma=55\))
- order sushi boxes from SushiFresh daily
SushiFresh GmbH
- receives orders from the stores (= demand)
- orders fish for the sushi boxes from Nord-Fisch KG and keeps a stock of fish in reserve
Nord-Fisch KG
- receives orders from SushiFresh GmbH (= demand)
- sources raw fish, produces the fish fillets and stores them in order to deliver quickly
Important
SushiFresh and Nord-Fisch each hold a (safety) stock of fish fillets to avoid shortages \(\rightarrow\) How high should it be?
Case example: SushiFresh GmbH
Situation of SushiFresh GmbH
Ordering process for fish fillets
SushiFresh GmbH decides daily on its production quantity of sushi boxes for the Frankfurt store (cf. newsvendor model slides). Based on sushi box demand, let \(d_t\) be the demand for fish fillet units on day \(t\) (Frankfurt store: \(\mu=280\), \(\sigma=55\)). SushiFresh can order replenishment from Nord-Fisch KG every day. Let the order quantity on day \(t\) be \(q_t\). Ordered fish fillets are delivered \(l=2\) days later. Let the physically available quantity of fish fillet units be \(i_t\). If no fish fillets are in stock, the demand is backordered (\(b_t\)) and produced or delivered later.
Sushi box inventories
- the physical inventory \(i_t\) is calculated as \(i_t = \max(0,i_{t-1} + q_{t-2} - d_t)\)
- the net inventory \(n_t\) also accounts for shortages \(n_t = i_{t-1} + q_{t-2} - d_t\)
- the inventory position \(p_t\) also accounts for open orders \(p_t = n_{t-1} + q_{t-1} (+q_t)\)
Case example: SushiFresh GmbH
Inventory of SushiFresh GmbH (Frankfurt store)
Demand
| Period | Demand |
|---|---|
| 0 | NA |
| 1 | 234 |
| 2 | 256 |
| 3 | 344 |
| 4 | 410 |
| 5 | 278 |
| 6 | 322 |
| 7 | 212 |
| 8 | 256 |
| 9 | 278 |
| 10 | 234 |
| 11 | 256 |
| 12 | 278 |
Initial inventory \(i_0 =\) 990 Order-up-to level \(S =\) 990
Case example: SushiFresh GmbH
Setting the order-up-to level
Ordering process & order-up-to level \(S\)
Setting the order-up-to level \(S\) determines the order quantity and the safety stock:
\[ q_t = S - p_t \qquad \qquad sb_t = S - \mu \cdot (l+1) \]
for a given \(\alpha\) service level
Extending the single-period formula (cf. pooling lecture) to multiple periods:
\[ S = \mu \cdot (l+1) + \sqrt{l+1} \cdot \sigma \cdot z_{\alpha}\]
for a given shortage cost rate \(c^u\) and inventory holding cost rate \(c^o\)
Applying the newsvendor formula:
\[ S = \mu \cdot (l+1) + \sqrt{l+1} \cdot \sigma \cdot z_{\frac{c^u}{c^u+c^o}}\]
Important
Important: the parameters \(\mu\) and \(\sigma\) are the expected daily demand (rate) (demand per period) and the expected deviation (standard deviation). Both parameters are estimated on the basis of empirical customer demand.
Case example: SushiFresh GmbH
Order decisions and their effects
Estimating the demand parameters \(\mu\) and \(\sigma\)
The parameters of the demand distribution are determined using statistical estimation methods (estimators), such as the (moving) average and the empirical standard deviation:
\(\hat{\mu} = \frac{1}{T} \sum_{\tau=t-T}^{t-1} d_\tau \qquad \qquad \hat{\sigma} = \sqrt{ \frac{1}{T-1} \sum_{\tau=t-T}^{t-1} (d_\tau - \hat{\mu})^2 } \rightarrow \;\text{forecast error}\)
| 1 | 2 | 3 | 4 | 5 | 6 | 7 | 8 | 9 | 10 | 11 | 12 | |
|---|---|---|---|---|---|---|---|---|---|---|---|---|
| Demand d[t] | 234 | 256 | 344.0 | 410.0 | 278.0 | 322 | 212.0 | 256.0 | 278.0 | 234.0 | 256 | 278 |
| Mean μ̂[t] | 256 | 234 | 245.0 | 278.0 | 336.7 | 344 | 336.7 | 270.7 | 263.3 | 248.7 | 256 | 256 |
| Standard deviation σ̂[t] | 1 | 1 | 15.6 | 58.2 | 77.3 | 66 | 67.2 | 55.4 | 55.4 | 33.6 | 22 | 22 |
| Order-up-to level S[t] | 771 | 705 | 779.0 | 1000.0 | 1230.0 | 1220 | 1201.0 | 970.0 | 948.0 | 842.0 | 831 | 831 |
| Order q[t] | 15 | 190 | 418.0 | 631.0 | 508.0 | 312 | 193.0 | 25.0 | 256.0 | 128.0 | 245 | 278 |
Observation
The variability of demand \(\sigma_d=\) 55.1 is considerably smaller than the standard deviation of the order quantities \(\sigma_q=\) 183.1 \(\rightarrow\) additional uncertainty is generated for Nord-Fisch KG
Bullwhip effect
Definition & illustration
Definition (Cachon and Terwiesch 2024)
The bullwhip effect is present in a supply chain if the variability of demand at one level of the supply chain is greater than the variability of demand at the next downstream level in the supply chain, where variability is measured with the coefficient of variation.
Typical patterns
Upstream effects
- “Amplification” of order quantities
- Inventory volatility increases
- more frequent shortages
Bullwhip effect
Typical observations
- usually \(q_t \neq d_t\), since the order quantity contains several components \[ q_t=\text{expected demand}+\text{inventory correction}+\text{safety stock correction}.\]
- suppliers cannot tell whether fluctuations in order quantities indicate long-term shifts (i.e. end-customer demand is rising) or short-term inventory corrections \(\rightarrow\) estimating future demand is difficult \(\rightarrow\) forecast errors increase \(\rightarrow\) order quantities fluctuate more
- hence the fluctuations of order quantities often increase with every stage of the value chain: \(\operatorname{Var}(d_t)< \operatorname{Var}(q_t^{i})<\operatorname{Var}(q_t^{i+1})<\operatorname{Var}(q_t^{i+2})< ...\)
Measuring the bullwhip effect
Measures of the bullwhip effect are the variance ratios \(B=\frac{\operatorname{Var}(q_t)}{\operatorname{Var}(d_t)}>1\) and \(B=\frac{\operatorname{Var}(q^{i}_t)}{\operatorname{Var}(q^{i-1}_t)}>1\)
\(\rightarrow\) the larger \(B\), the stronger the bullwhip effect
Bullwhip effect
Empirical evidence (Bray and Mendelson 2012; Chen and Lee 2012; Yao et al. 2020)
\(2/3\) of companies
In a sample of 4,689 listed US companies, around two thirds showed a positive amplification of procurement variability relative to sales variability.
\(+15.8\%\) on average
The mean bullwhip amplification was \(15.8\%\) of demand variability; the median was \(6.7\%\).
Order of magnitude
On average, the quarterly standard deviation of upstream orders exceeded that of observed demand by around USD 20 million.
Real performance consequences (Yao et al. 2020)
A stronger bullwhip effect is associated with a higher inventory ratio and at the same time more stockouts \(\rightarrow\) safety stocks are insufficient
Aggregation conceals the problem
Metrics aggregated across products, stores or time underestimate the bullwhip effect compared with measurement at SKU level.
Management message
It is not only end-customer demand that creates volatility:
\[ \text{demand signal} + \text{local ordering decisions} = \text{order variance} \]
Bullwhip effect
Causes of the bullwhip effect
| Cause | Mechanism |
|---|---|
| Local forecasts | Orders are interpreted as actual demand |
| Forecast updating | Small changes in demand lead to adjustments of order-up-to levels |
| Long lead times | Decisions must take effect far into the future |
| Order batching | Infrequent large orders create artificial demand peaks |
| Price promotions | Forward buying distorts observed demand |
| Rationing | Actors strategically order more than their actual demand |
| Lack of transparency | End-customer demand is not visible to all stages |
| Local systems of objectives | Stages optimise individually rather than system-wide |
Bullwhip effect
Typical consequences
Operational consequences
- Fluctuating production schedules
- Unstable capacity utilisation
- Express shipments and special measures
- High inventories and yet shortages
- Lower delivery capability
- Greater planning uncertainty
Economic consequences
- Higher capital tie-up
- Higher warehousing costs
- Higher obsolescence risks
- Higher set-up and production costs
- Higher transport costs
- Losses in revenue and contribution margin
Bullwhip effect
Countermeasures
| Lever | Measure | Effect on inventories and variance |
|---|---|---|
| Information flow | Share point-of-sale data | \(\sigma\) of forecast errors decreases |
| Planning | Joint forecasts and CPFR | Local forecast bias decreases |
| Ordering policy | Small, frequent orders | Order batching decreases |
| Lead time | Shorten information and delivery lead times | Risk period decreases |
| Prices | Stable prices instead of forward-buying incentives | Artificial demand peaks decrease |
| Allocation | Rationing based on historical quantities | Strategic over-ordering decreases |
| Control | Overall optimum instead of local targets | Order and inventory decisions are coordinated |

Supply Chain Management